Introduction
As you learn to use IGB, you'll find it offers many features that make it one of the best tools available for visualization and exploration of genomic data sets.
If you are new to IGB, the following Quick Start Guide will help you get started.
Step 1: Get and start IGB
- Go to bioviz.org/igb/download.html IGB Download Page
- Download and launch IGB
If you have trouble starting IGB, see Troubleshooting or ask for help on the Genoviz Help Forum.
Step 2: Choose species and genome version
To choose a species and genome version
- Click a shortcut image (loads most recent genome)
or
- Choose Species and Genome Version using the Current Genome tab.
IGB start screen
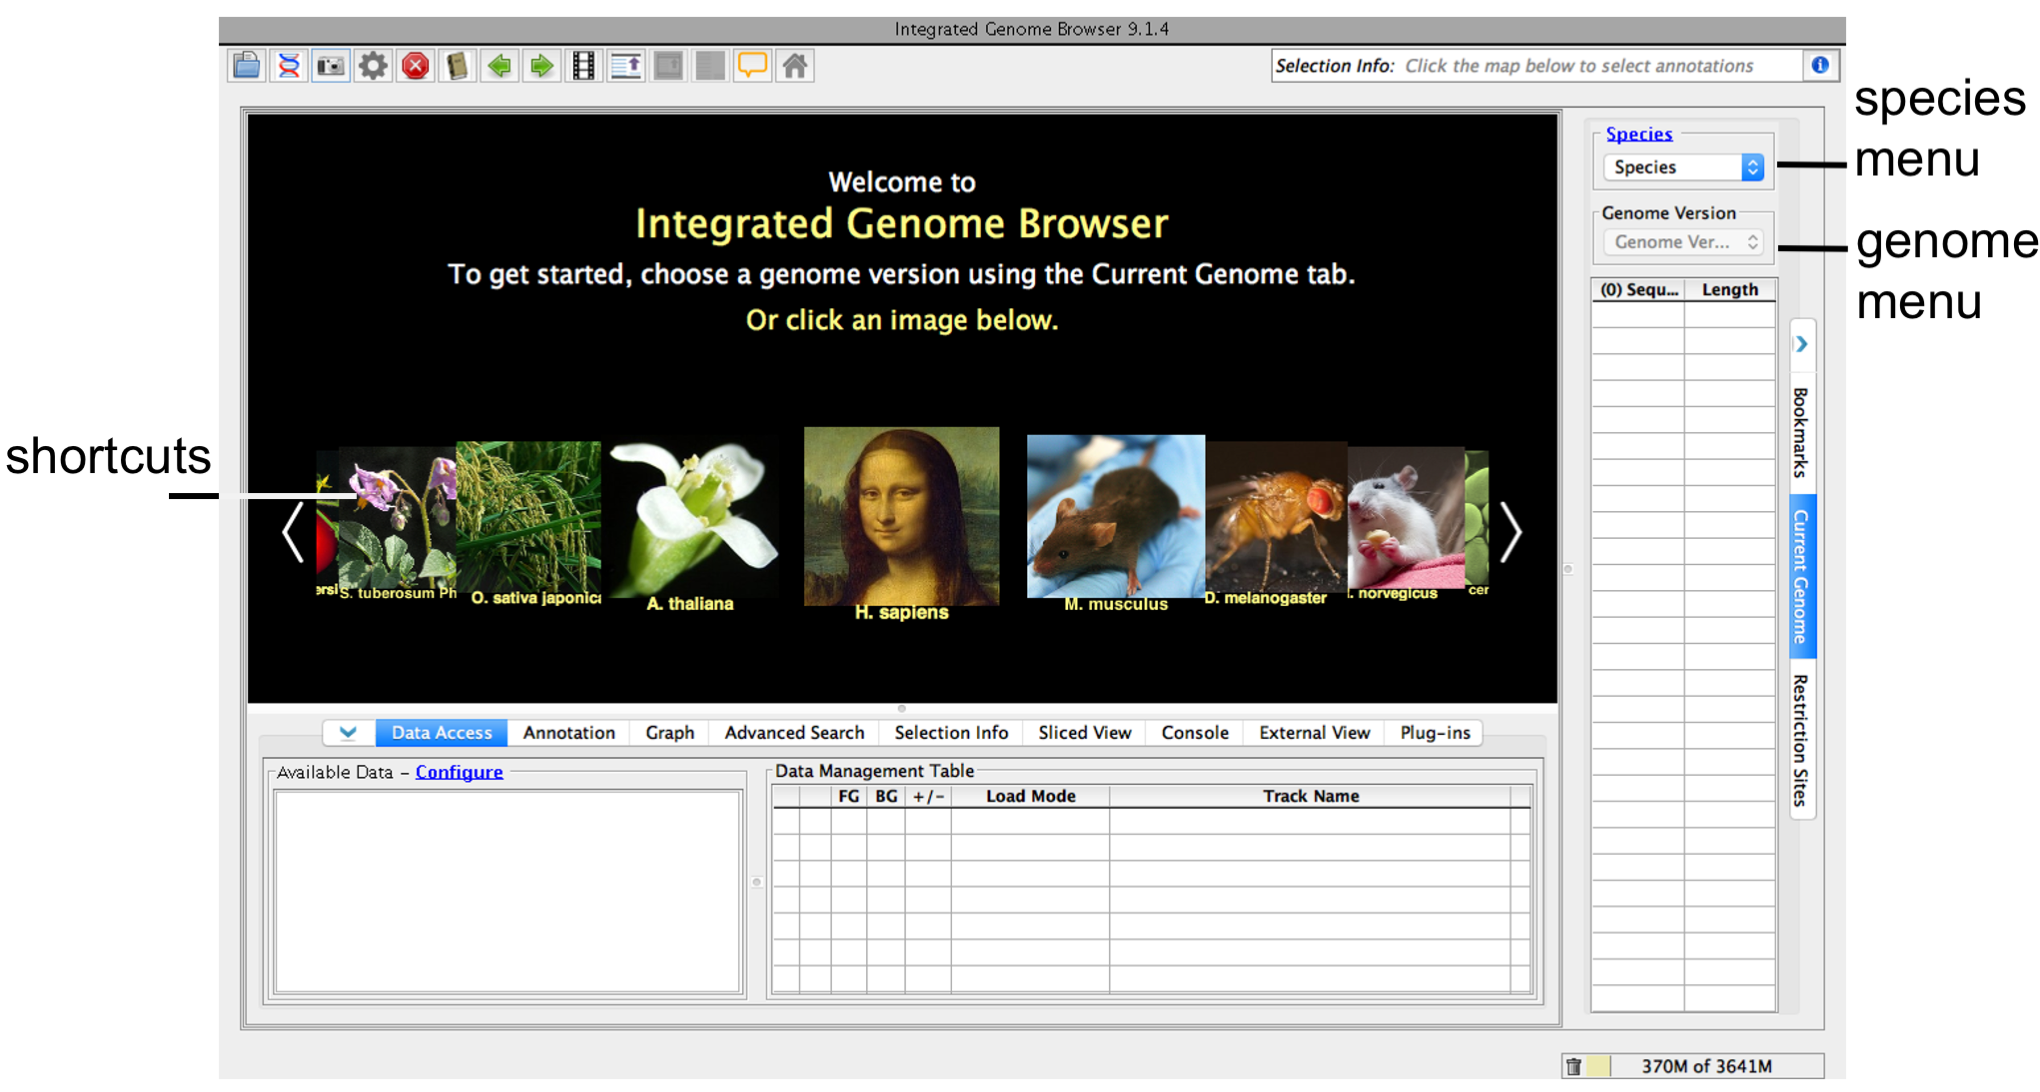
If your species or genome version is not listed, you can enter it as a custom species and genome when you open a data file. For more information, see Custom Genomes
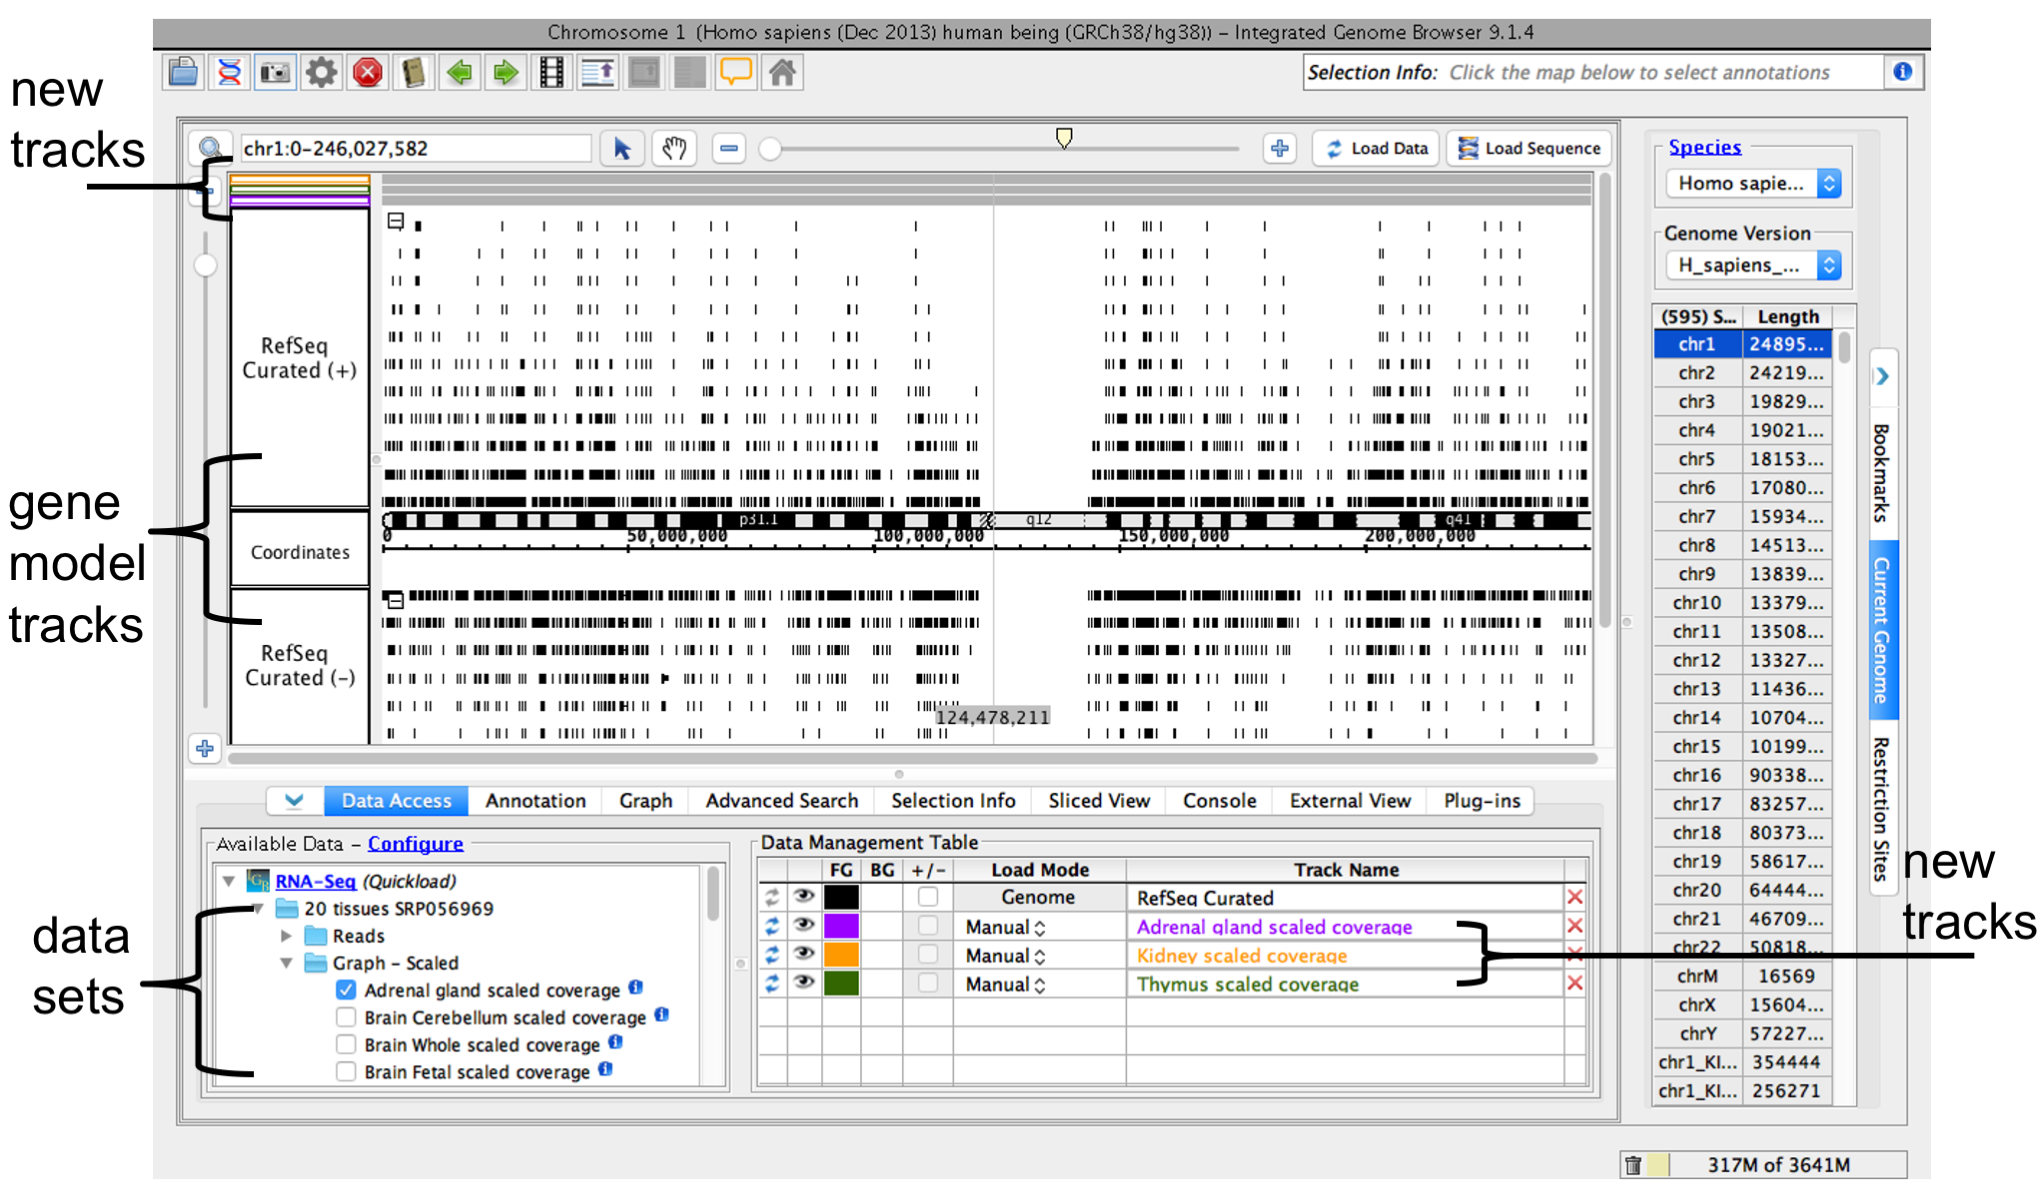
Step 3. Open data sets
Open data sets from remote data sources (Data Access tab) or by opening local files.
To open a data set from a remote data source
- Select Data Access
- Select data sets in the Available Data sub-panel
To open local files on your computer
- Select File > Open File... or File > Open URL...
- Enter file name or URL
When you select a data sets or a file, IGB will add a new empty track to the main view and list it in the Data Management table. Regions that do not have data loaded have a darker background color.
IGB window after opening a data set
Open reference sequence (optional)
If you would like to open a sequence file (fasta or 2bit format) to use as the reference sequence
- Select File > Open Reference Sequence...
- Choose the file
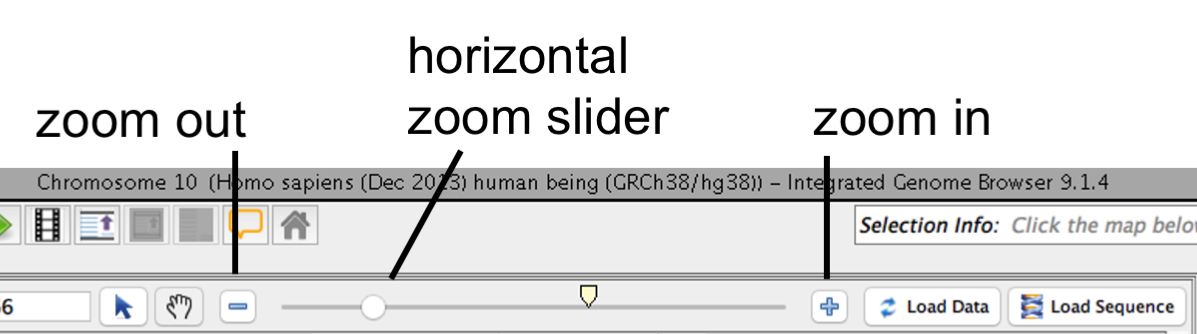
Step 4: Zoom in
Because many data files contain too much data to view all at once, IGB does not load data into the viewer until you click the Load Data button.
Before loading data, zoom in to a region.
- Click a location in the main view
- Drag the horizontal zoom slider or use plus and minus buttons
IGB horizontal zooming controls
Other ways to zoom
Other ways to zoom include
- Search for a gene by name
- Double-click a feature
- Click-drag within the coordinate axis
See also:
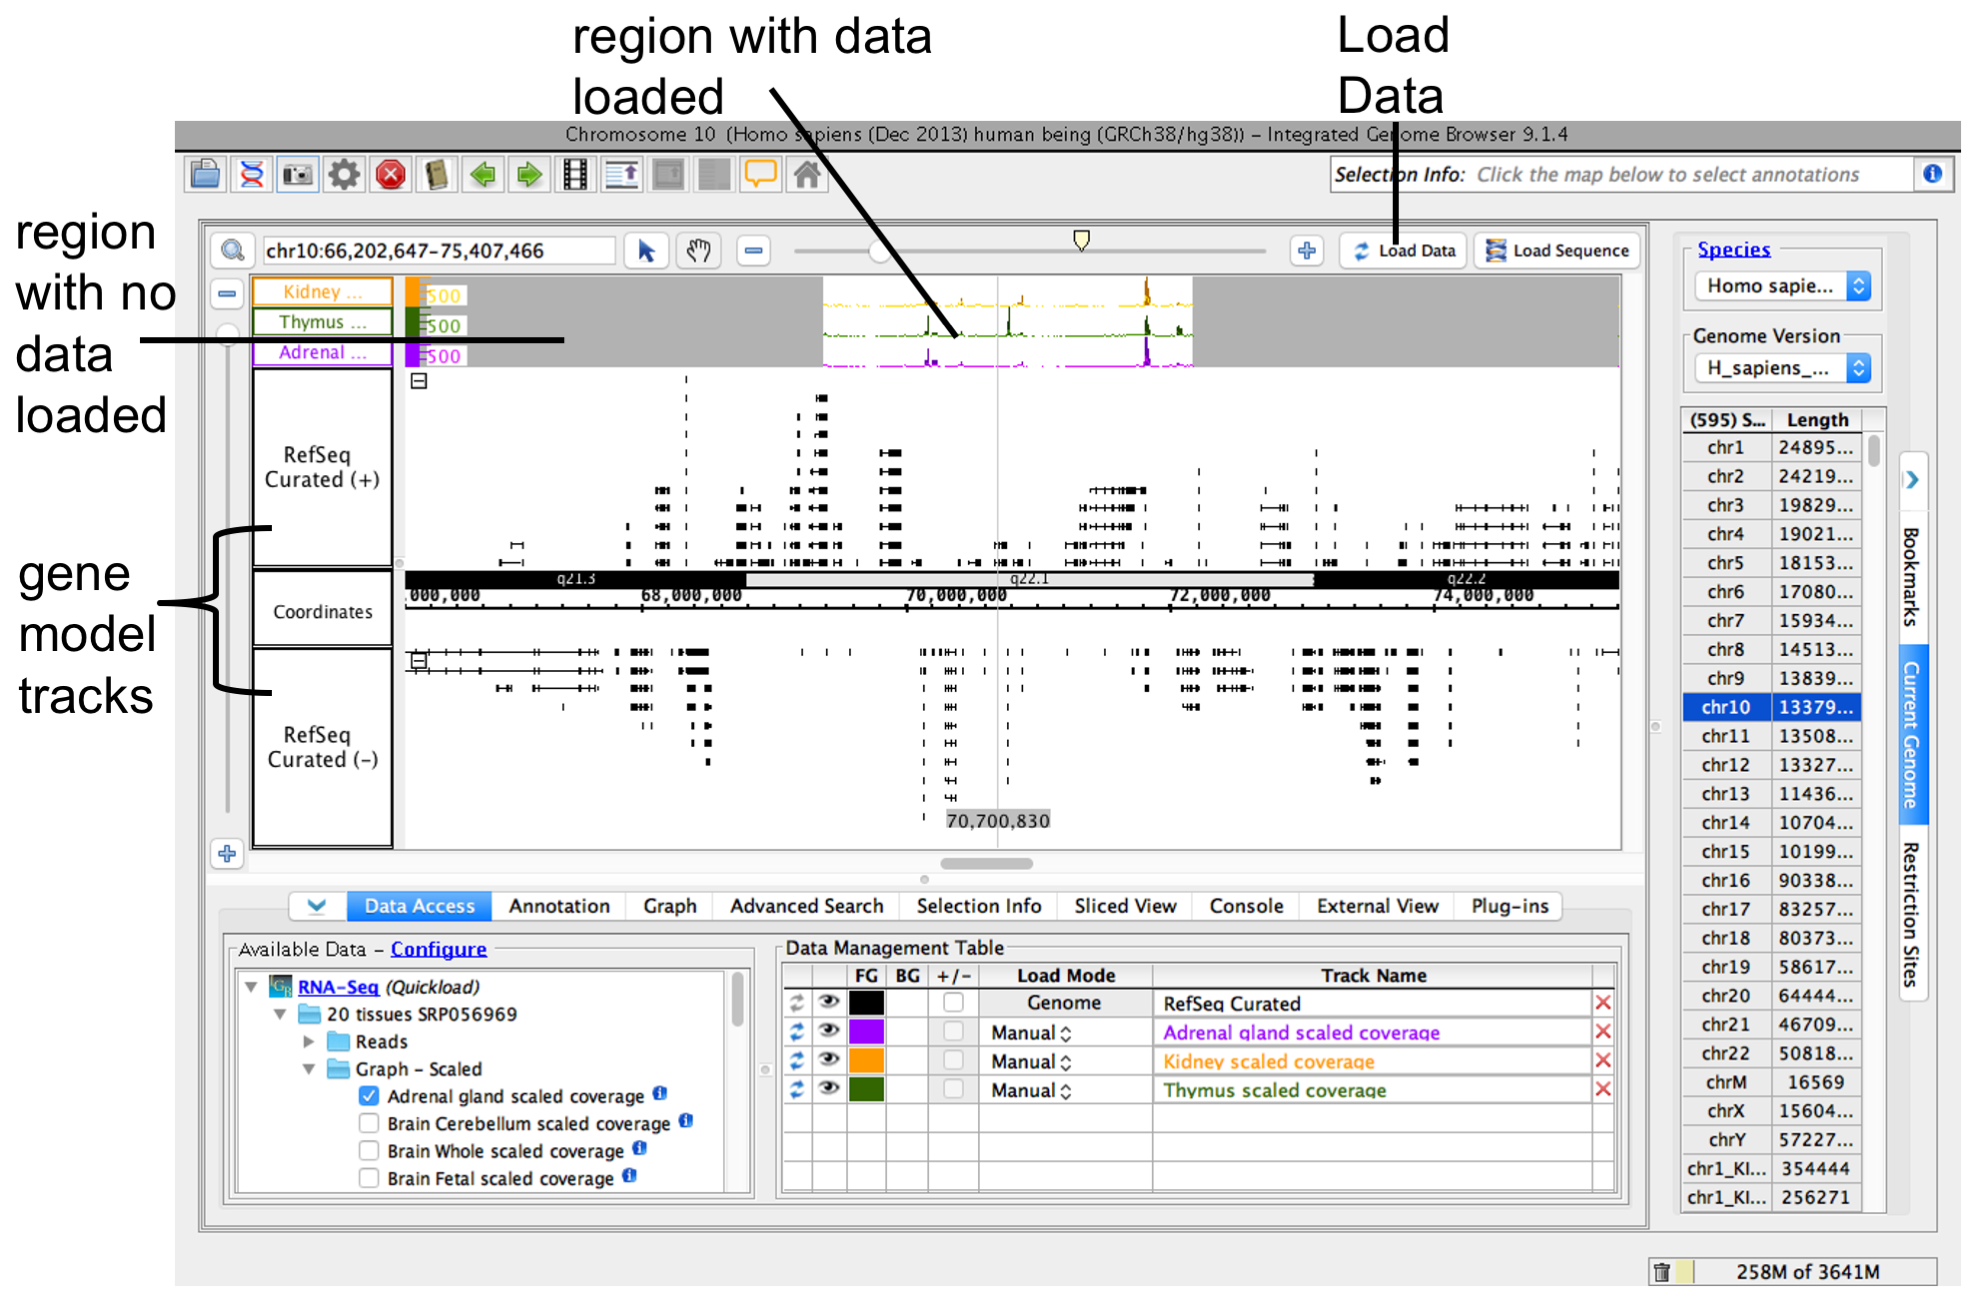
Step 5: Load data
To load data, click Load Data button. Regions with loaded data show the selected background color; areas without loaded data appear darker.
IGB after loading data
See also:
Step 6: Configure tracks
You can reorder the tracks by dragging the Track Label (the Data Management Table reflect changes).
To change style elements of a track, click the track label and use the Annotation or Graph tab to change to change color, track height, annotation label, amount of data shown (stack height), and other options.
See also: