The IGB main window contains tabbed panels, the main data display, toolbar, and navigation tools.
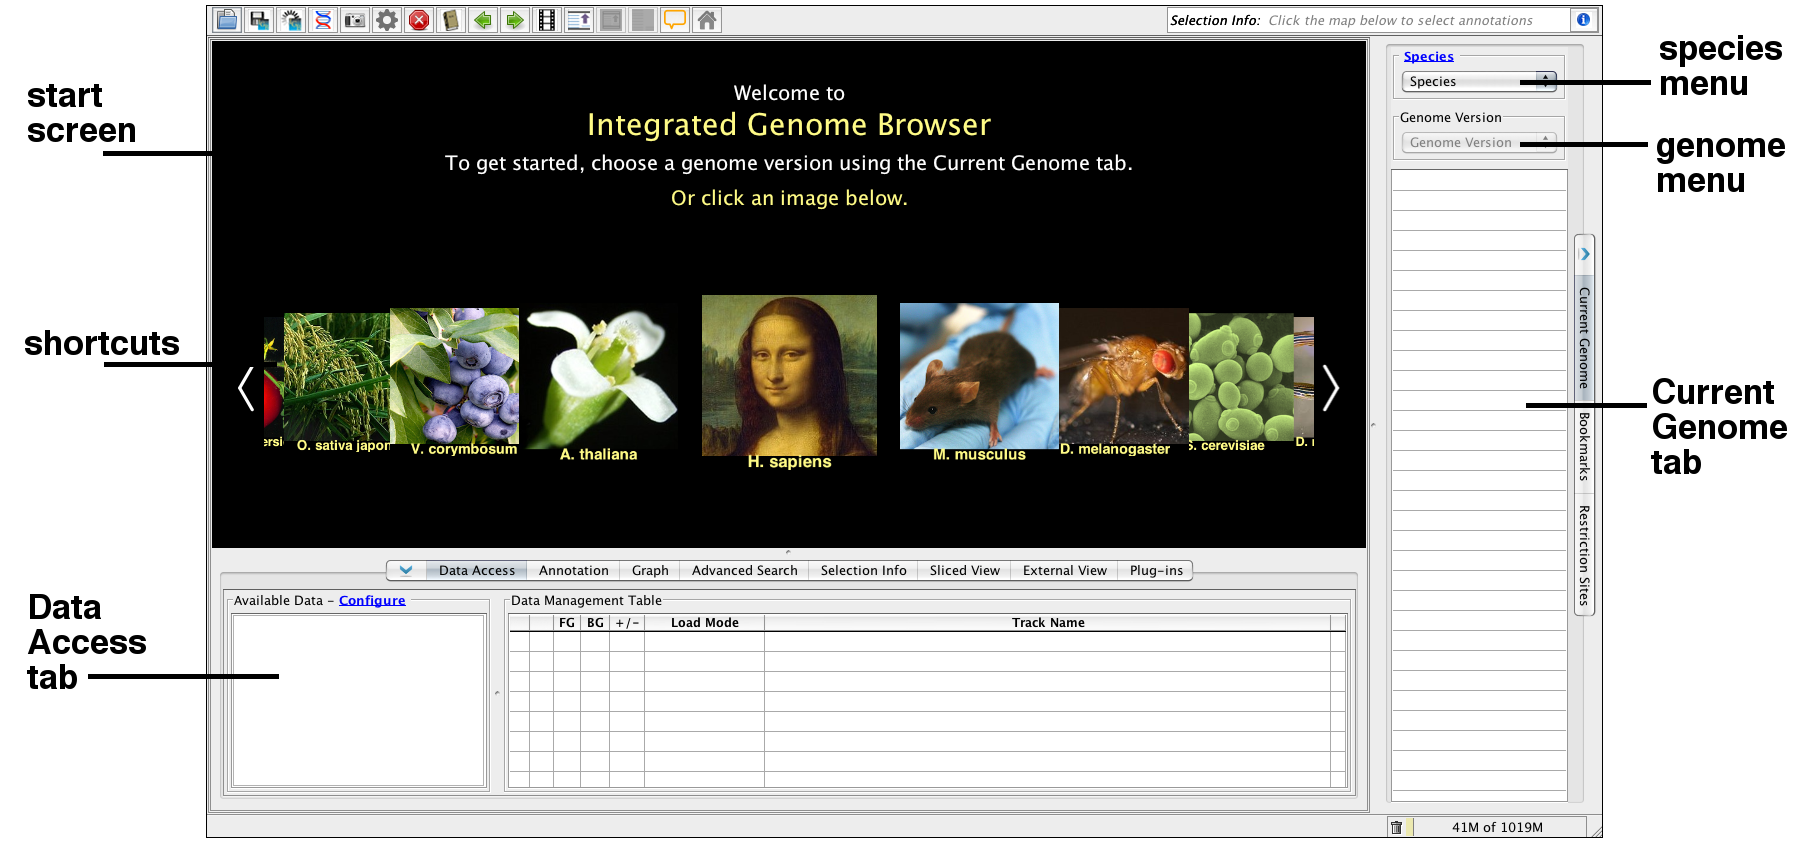
IGB start screen
When IGB first launches, the IGB window contains
- Start screen with shortcuts to recent releases of model organism and human genome versions
- Current Genome tab on the right
- Data Access tab on the lower part of the IGB window.
IGB start screen
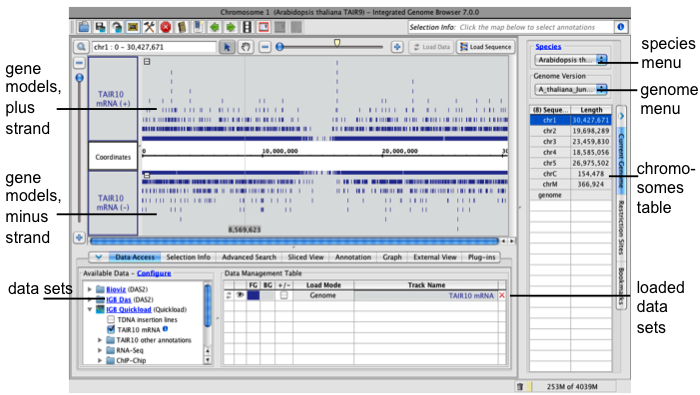
When you choose a genome, a view of the first chromosome listed in the Current Genome tab replaces the IGB start screen.
If available, reference gene models annotations for the selected genome will load from a remote IGB data source or from your local file cache if you loaded the genome previously.
IGB after selecting a genome
IGB main window
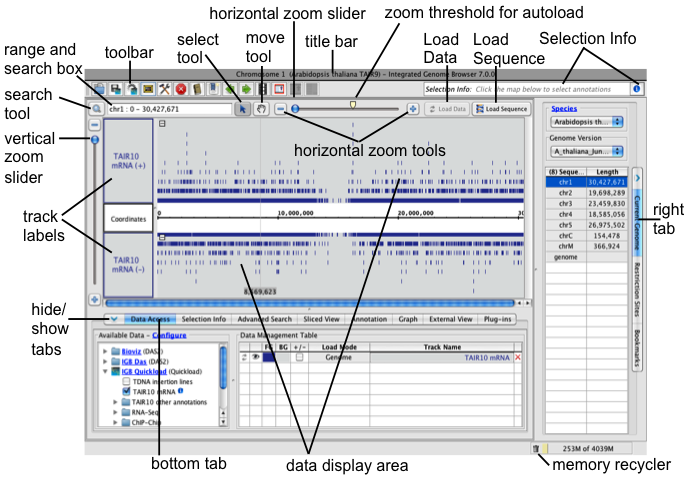
The IGB main window contains
- Data display area with central coordinates axis and tracks
- Title bar indicating the chromosome and genome version on display
- Toolbar with shortcuts to commonly used functions
- Selection Info box which shows information about selected annotations or data sets
- Load Data button which triggers loading of data into the viewer. See Loading data.
- Load Sequence button which loads genomic sequence bases for the region in view
- Navigation tools including zoom sliders, scrollbars, move tool, left and right scroll tools
Navigation tools
The range box and search box shows the chromosome and genomic coordinate range currently in view. Use the range and search box to search loaded annotations by name or keyword.
Horizontal and vertical zoom sliders control the zoom level. Use the horizontal and vertical zoom sliders to control zoom level. Zooming in shows less data in greater detail and zooming out shows more data in less detail. Use the + and - buttons to zoom incrementally.
The horizontal zoomer also has an AutoLoad Threshold mark showing the zoom level at which IGB will automatically load data from data sets whose Load Mode setting is to Auto. (Details are in Loading data)
Use the move tool (hand icon) move the data display field in any direction.
Use the select tool select items by clicking on them. Click or click-drag over items in the display to select them or or click-drag selection tool over the coordinate axis to zoom in. See Selecting Items.
Data display area
The data display area tracks and the coordinate axis. It is split vertically, with the track labels on the left and data on the right.
Track labels show track names. Right-clicking a track label opens a menu with options to change track appearance, save tracks, and other functions. You can also click and drag track labels to change the vertical ordering of tracks.
The coordinates track displays genomic coordinates and separates minus and plus strand tracks. The coordinates track contains
- A cytobands track with chromosome ideogram (for human and a few other genomes only)
- A number line representing the genomic sequence axis
- The reference genomic sequence, which when loaded appears below below the number line.
Annotation tracks
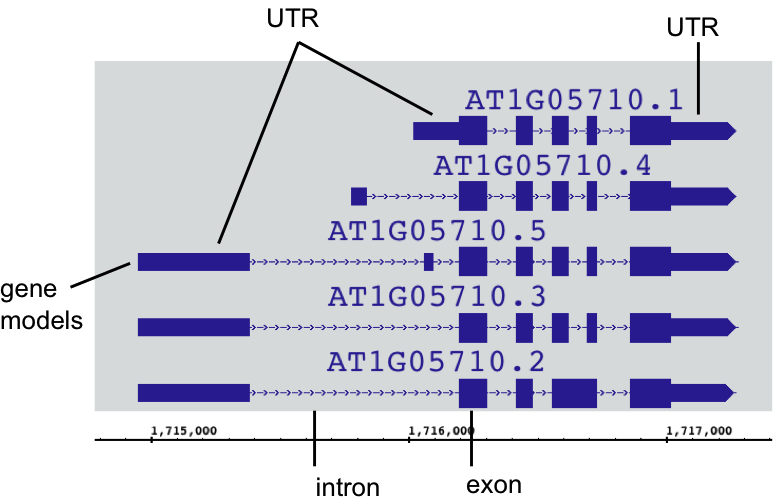
IGB depicts gene annotations as blocks representing exons linked by lines representing introns. Translated regions (CDSs) appear as taller rectangles, and untranslated regions (UTRs) are indicated by thinner exons, as in the following example.
Example gene model
When space permits, IGB displays labels next to annotations, depending on settings for the track. To see labels, uses the vertical or horizontal zoom sliders to zoom in. Once annotations are large enough, labels appear.
To change the appearance of gene models in a track
- Select the track by clicking its track label
- Select the Annotation tab
- Select options under Style and Labels and Strand
Not every gene model has annotated UTRs. When UTRs are not annotated, all exons are the same height.
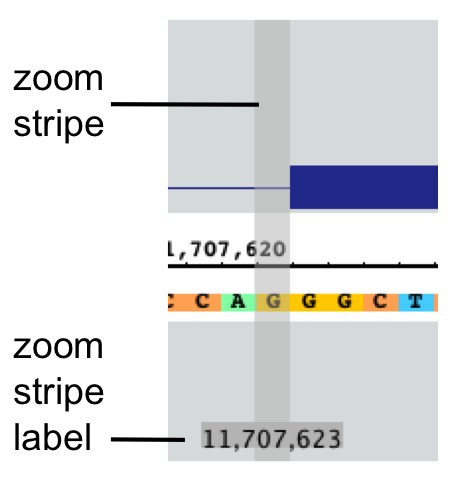
Zoom stripe
The zoom stripe indicates the location of the most recent click. It indicates the focus for zooming, the position in the display that remains stationary when you zoom horizontally.
The zoom strip label indicates the location of the zoom stripe.
