Introduction
IGB allows you to manipulate graph tracks in multiple ways, both by transforming an individual track or by combining two graph tracks in a mathematical way. Controls for transforming and combining graphs can be found in the Graph tab. Any track that has been transformed or combined can be saved as WIG, BEDGRAPH, or EGR (see File Formats for more details).
Duplicating graphs
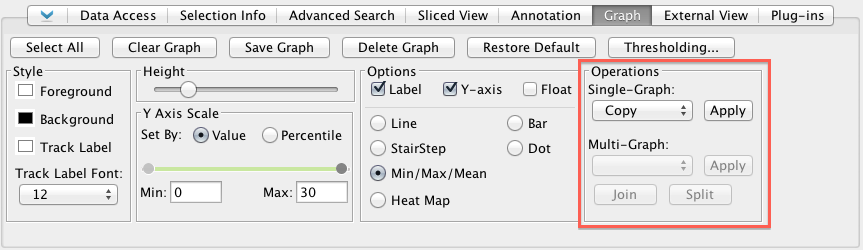
You may want to duplicate a graph to experiment with different graph adjustments without losing adjustments that you have already made. The first choice in the Track Operations drop down menu is Copy (see image of Graph tab), which makes a copy of the graph without any transformation. This can be useful if you want to explore the effects of showing one graph in two graph styles at the same time.
Select the graph, set Track Operations *to *Copy.
Transforming
By default, all graphs display in linear scale, but IGB allows you the option to transform a graph into other scales. Select the graph(s) and open the Graph tab. Select the type of transformation you would like to perform from the pull-down menu labeled Single-Graph in the Operations panel.
The picture below includes all of the options available in IGB.

IGB duplicates your graph in a new track and applies the selected scale to the new graph; your original graph is not deleted.
Joining and Splitting graphs
It is possible to join two or more graphs into a single track. The two (or more) graphs will then have a single track tier label and can be moved and adjusted as a group. To join multiple graphs, select them, then press the Join button in the Operations panel of the Graph tab. To separate these graphs, select the joined track and press the Split button. To switch between the expanded and collapsed state, right-click in the joined track label, and choose between Expand and Collapse.
When the track is in the expanded state, the multiple graphs are shown in separate non-overlapping bands.

If the tier is collapsed, all graphs are shown in the same, overlapping band. When joined graphs are collapsed, any opaque regions of the top graph will hide corresponding features of the lower graph or graphs.

Joining graphs into a single annotation track can be very useful for expression data from multiple experiments. Here, data from several experiments at different times during the development of an organism are shown together in a single track, and it is easy to see that expression of genes is being regulated over time.
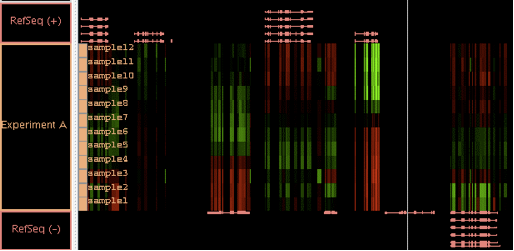
By selecting the single tier label, here labeled "Experiment A", you can easily set the graph style and data range for all these graphs to be identical.
Combining Graphs Arithmetically
IGB allows you to work with numerical/graph data, allowing you to do quantitative comparisons between data sets. This is especially useful for comparing experimental results between a control and treatment group, for instance. You may need to compare the relative differences in expression levels, or you may need to generate an average. For example, a graph of cancerous cells will show what's turned on or off when compared to a graph of normal cells. Results that show significantly more or less activity than a control graph for the same region may indicate an area of interest. While you can use the Combine Annotations functions to qualitatively locate regions of interest, combining graphs will give you quantitative answers.
IGB allows you to work with 2 graph tracks at a time. The first track selected will be given a temporary label of 'A'. Shift click selection of the second track will give it the temporary label 'B'. After the two tracks have been selected, you choose the mathematical function from the Multi-Graph option of the Operations panel.

IGB will open an new track for the newly created graph. It will be titled as the name of the function performed, and then each of the original tracks in parenthesis. The new track can be adjusted for style and display just as any other graph track.