Operations - making new graphs from old ones
IGB supports multiple types of graph manipulations via the Operations section of the Graph tab. To perform a graph operation:
- Select the graph (or graphs) by clicking the corresponding track label. SHIFT-click to select more than one graph.
- Select the Graph tab
- Select the operation you wish to perform
Note that single-graph operations operate on single graph tracks. Multi-graph operations operate on two or more tracks.
The result will appear in a new track, labeled with the operation used to create it. When you load new data, the track containing the result of the operation will update.
Tip: Save the result to a file by right-clicking the track and select Save As. Only data for the current chromosome will be saved. (This may change in future releases of IGB.)
Joining and splitting graphs
It is possible to join two or more graphs into a single track. Graphs that are joined into one track share a track label. Operations performed on the joined graph apply to each of the joined graphs.
To join graphs:
- Select two or more graphs by SHIFT-clicking their track labels
- Select Graph tab
- Click the Join button (under Operations)
To separate joined graphs:
- Select the joined graph by clicking its track label
- Select Graph tab
- Click the Split button (under Operations)
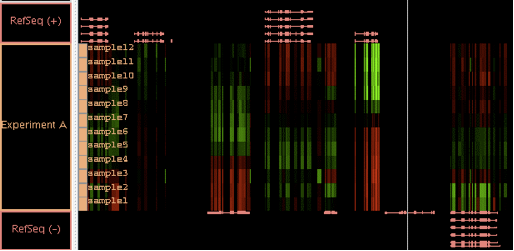
Tip: Use the Y Axis Scale settings to put joined graphs onto the same scale. Click the "collapse" tool (upper left of joined graph track) to overlay and compare the joined graphs. Or set their style to Heat Map to view multiple experimental samples in the same track. For example, the following image shows data from a developmental time course highlighting expression changes over time.

