Introduction
Graphs contain numerical data associated with base pair positions along the chromosome sequence axis, such as sets of scores or chromosome copy numbers at specific positions. IGB allows you to visualize such graph data and compare it with RefSeq and other annotations.
Examples of suitable data include:
- Files generated from Affymetrix software tools, such as the Expression Console, CNAT, GCOS, or ExACT.
- Expression values from genome tiling arrays.
- Density of ESTs across chromosomes
- GC content along chromosomes
- Measures of conservation between two genomes
There are two basic types of graphs:
- Position graphs associate scores with single genomic positions.
- Interval graphs associate scores with ranges of genomic positions.
Here is a very simple example of several interval graphs:
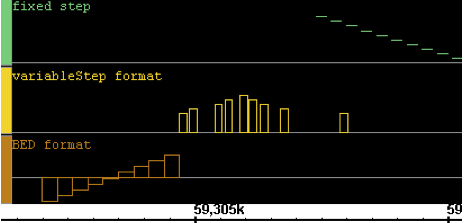
IGB will recognize whether the graph is a position or interval graph and will display it accordingly.
The child pages explain how to use IGB to examine your graph data:
- Compare graph and annotation data in the same region.
- Adjust graphs to highlight features
- Fine-tune graph scaling to improve visibility
- Use thresholding to transform graph data into annotation-like format, in order to examine it further using other tools in IGB.