Introduction
IGB aims to be an integrated genome browser, meaning it can display data from a variety of diverse data sources, all merged into the same view. This includes data sets loaded from your computer, from URL sites, or from various public (and private) DAS, DAS2 and Quickload servers. IGB can also display data from many file types, including:
- Short read alignments data, aka "next generation sequence data" (BAM format)
- Standard annotations such as RefSeq annotations, provided by public repositories
- Alignments of Affymetrix probe sets to the genome, provided by the NetAffx group at Affymetrix (link.psl format).
- Alignments of ESTs or mRNAs produced by blat (psl formats)
- Tiling array graphs, from the TAS program from Affymetrix
- Copy number graphs from the CNAT program Affymetrix
- Data generated from other Affymetrix software tools, such as GCOS, Expression Console and ExACT.
- Annotation and graph files prepared by any method in any of the supported formats.
A list of supported file formats is here.
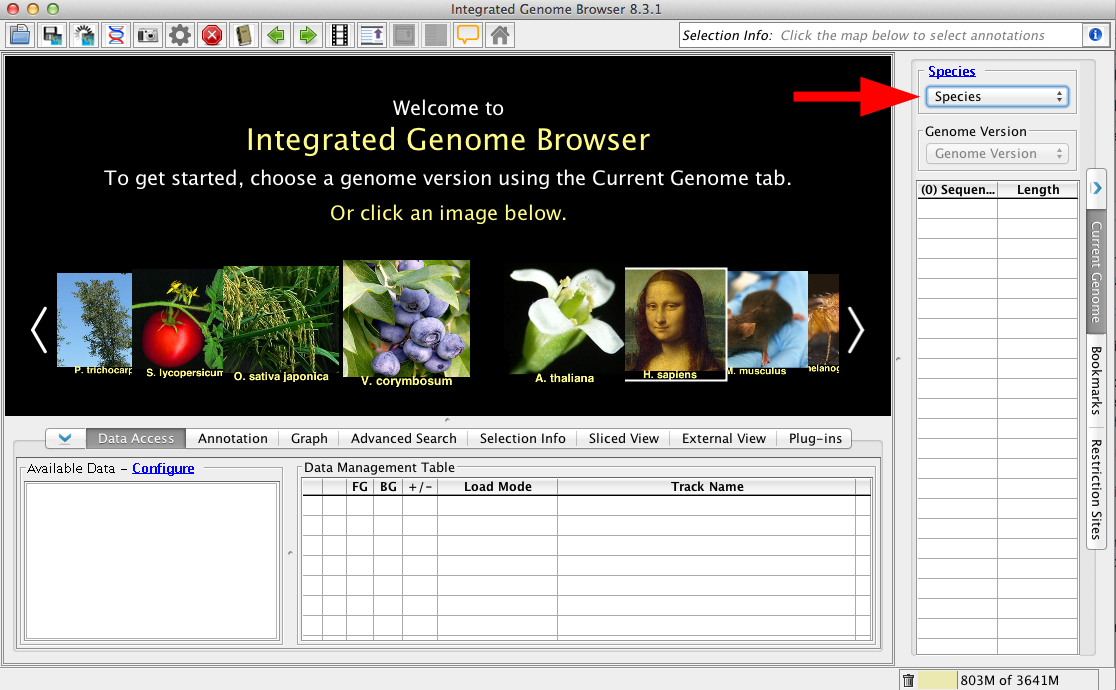
Choose Species and Genome Version
The first step to loading data is to choose Species and Genome Version. IGB uses this information to offer data sources with relevant data sets. To set the species and version, select them in the Current Genome panel.
Loading data sets
IGB does NOT immediately display loaded files. Many of today's next-gen sequencing files are too big to display all at once. IGB handles this issue by waiting to visualize data sets until you ask it to load data.
While you can immediately refresh to visualize most files, many larger file types, such as BAM and WIG should first have a defined, smaller region selected prior to refreshing the image.
There are several ways to get data sets into IGB, from servers/sources, from URLs and from the local computer. To load data from a server, locate the data set in the folders of the Data Sources panel. Put a check in the box next to the data you are interested in. This file will be entered into the Data Management Table.
For files loaded from URL or from the local computer, just drag and drop into the IGB interface; the file will immediately appear in the Data Management Table. Alternatively, use the File > Open File.. or Open URL... to find and load the file(s) you want. Be sure to set the species and genome at the bottom of the file selection window.
Data Management Table
IGB is capable of loading and displaying whole genomes, whole chromosomes or just portions of a data file, depending on the file type. Therefore, although there are many load options, not every file type can be loaded the same way. There is always the option of Don't Load, which will simply not load the individual file but will maintain it in the list.
- Don't Load is the setting for not loading any data, but remaining in the Data Management Table
- Genome is primarily used with sequence files; this is the default load that IGB uses for the reference sequences for most model organisms (e.g. TAIR10 mRNA)
- Manual is the default Load Mode for IGB. This setting tells IGB to load only the region in view (e.g. CoolI1T1.sm.wig). For large files, such as .bam, .wig or other short read associated files, we strongly recommend that you zoom into a small region of interest, usually about <100Kb depending on your read density, and then Load Data to see this region. This is the default setting for most files.
- Auto is an option for BAM and SAM files (e.g. CoolI1T1.sm.bam), which will allow IGB to automatically load the data in view, if the view is zoomed below the Auto threshold, marked with a yellow arrow head (red arrow). The Auto zoom level can be adjusted to your needs. First, set the main view to the zoom level you want. Then, View > Set AutoLoad Threshold to Current View. This will change the needed zoom level AND will move the yellow arrow to indicate the new threshold setting.
If you set the Autoload threshold too high, IGB will try to load all of the indicated data, which could exceed the memory limit.

Load data to visualize
If the data is set to Load Mode > Manual, simply click Load Data. If you want all the tracks to load data at once, use the Load Data button (red box, arrow); to load a single track use the Load Data icon in the Data Management Table (red arrow). Sequence can be loaded from the Load Sequence button (purple box, arrow).

You might load a track and then zoom out to show a greater region of the data sets. IGB will show gray where the track is not loaded yet (red arrows).
