
Filter...
- Open the H_sapiens_Dec_2013 genome
- Add a Data Source using the following URL (if not already added): https://quickload-testing.s3.amazonaws.com/smokeTestingQuickload/
- Navigate to chr2:232,546,991-232,551,587
- Check that only the RefSeq Curated annotation is loaded
- Right-click on the track name and select Filter...
- In the Add/Remove/Edit Filters window, click Add
- In the Add filter window, use the dropdown to select Reads with no gaps
- Click OK
- Click OK
- In the Add/Remove/Edit Filters window, click Add
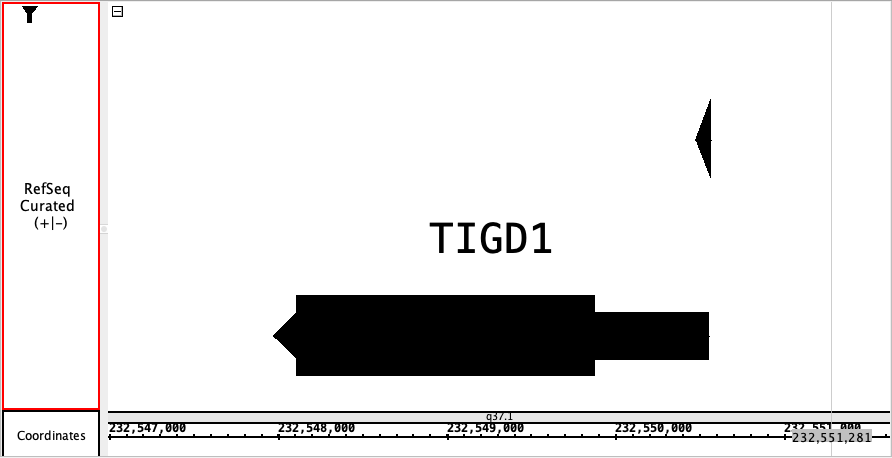
- Check that the track matches the image above.
- Mac
- Linux
- Windows
- Right-click on the track name and select Filter...
- In the Add/Remove/Edit Filters window, select Reads with no gaps
- Click Remove
- Click OK
- Check that the filter is removed and the missing annotations are visible.
- Mac
- Linux
- Windows
- Navigate to chr16:28,931,601-28,939,711
- Add the Bam - CD19 Single-cell RNA-Seq from 10X Genomics file to IGB
- Click Load Data
- Right-click on the track name and select Optimize Stack Height
- Right-click on the track name and select Filter...
- Click Add
- Select SAMtags
- Select CB
- In the value field, enter the following: GGTGAAGAGGGAGGAC-1;GGGACCTGTATCGTAC-1;AAGACTCTCGAGTTGT-1;TTAGTCTAGACAACAT-1;ATACCGAGTTCGTAAC-1
- Click OK
- Click OK
- Click Add
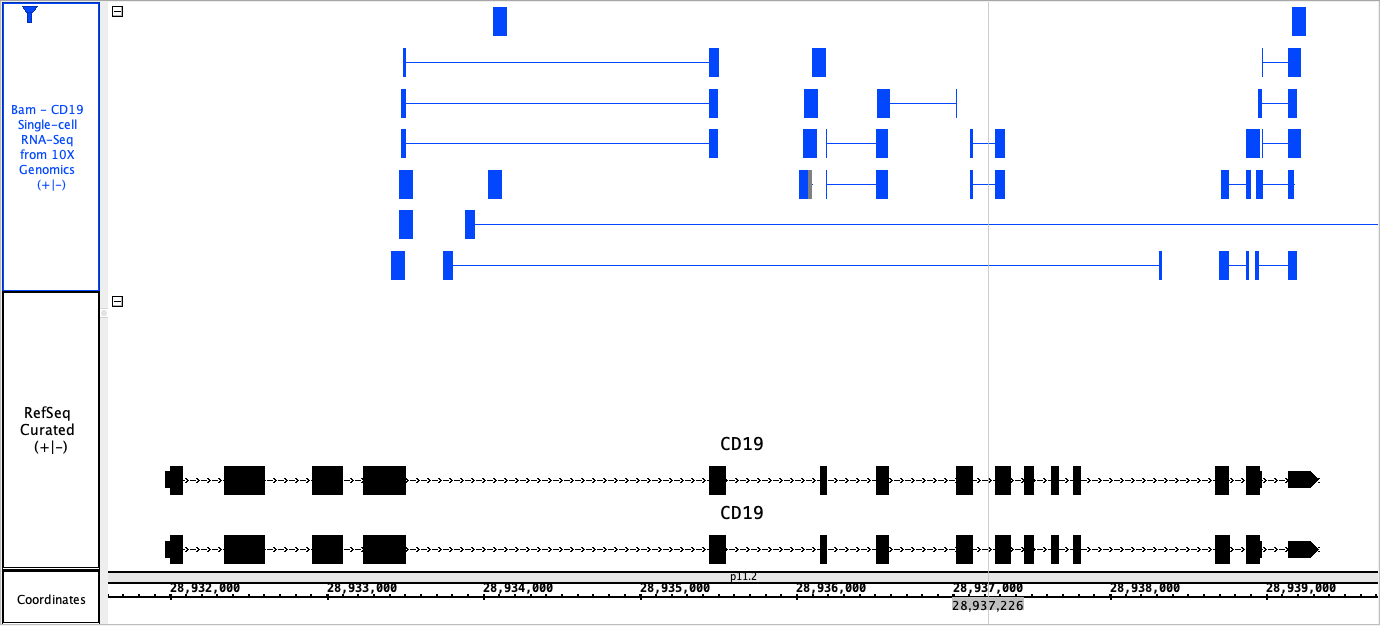
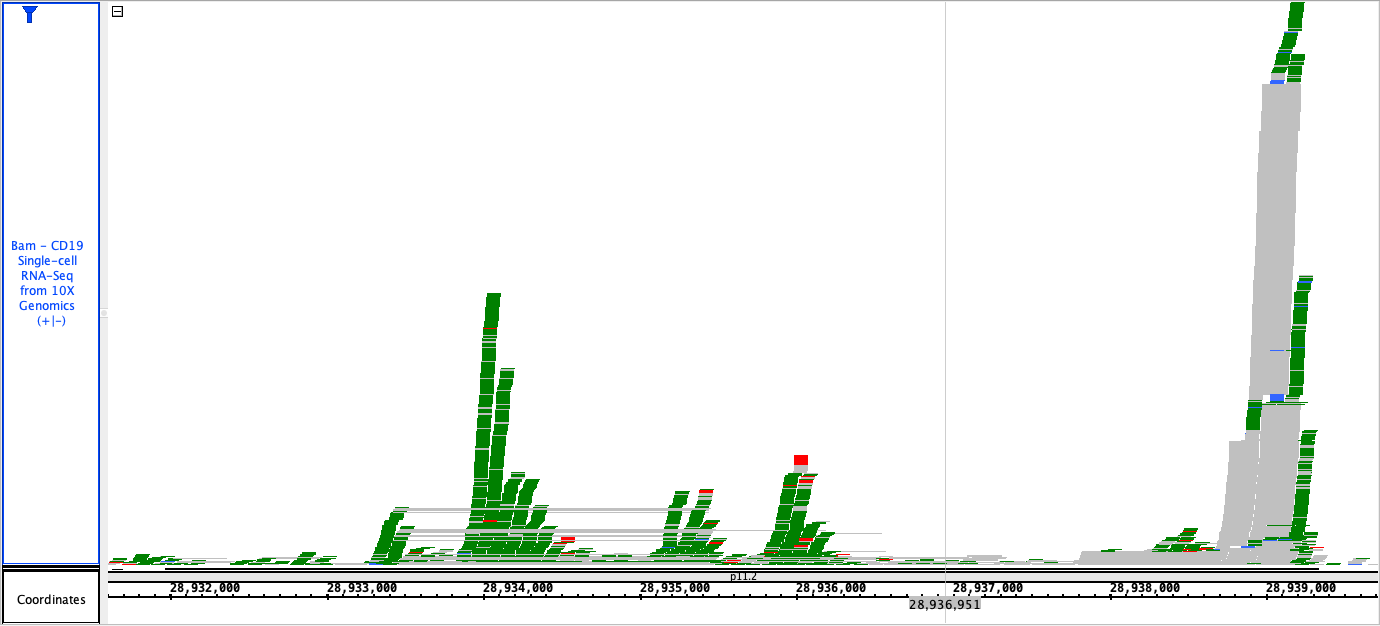
- Check that the track matches the image above.
- Mac
- Linux
- Windows
- Right-click on the track name and select Filter...
- Click Edit
- Select =/= (does not equal) from the comparator drop-down menu
- Click OK
- Click OK
- Click Edit
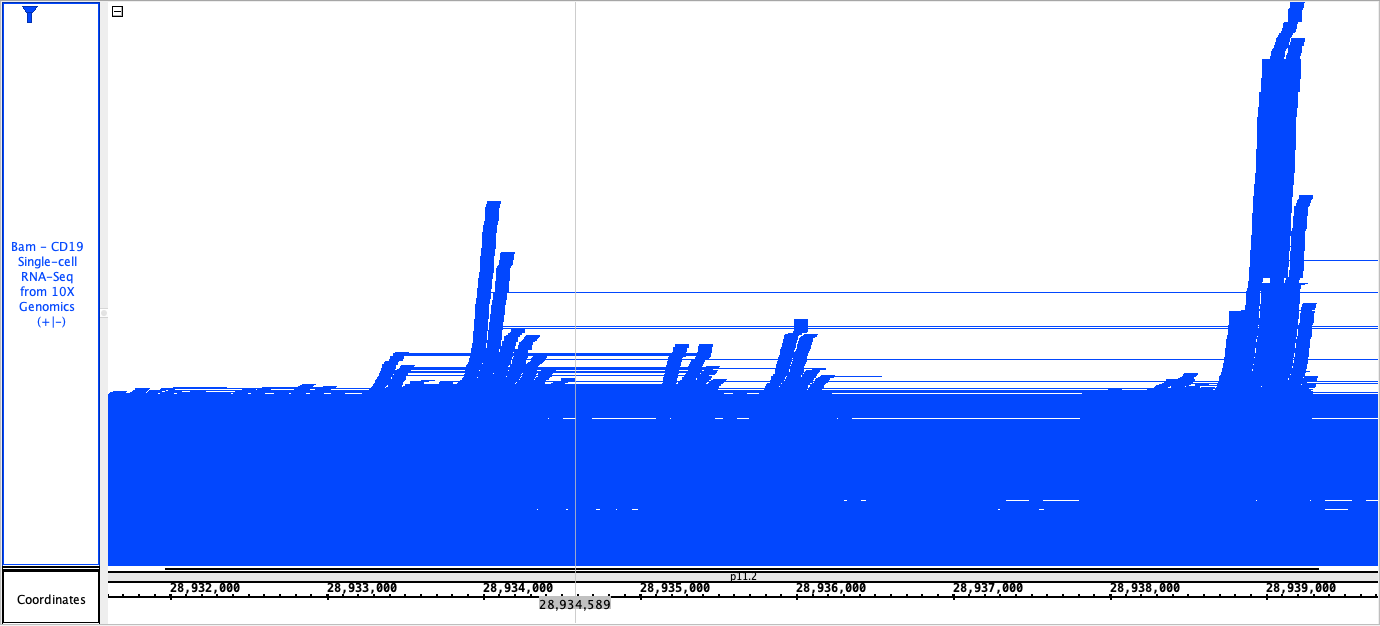
- Check that the track matches the image above.
- Mac
- Linux
- Windows
- The filter settings were the same after closing and opening the Edit filter window.
- Mac
- Linux
- Windows
- Install the Monster Alignment Filter plugin through the IGB App Manager (Tools > Open App Manager)
- Right-click on the track name and select Filter...
- Click Add
- Select Reads without monster gaps
- Set the Max intron size to 4000
- Click OK
- Click OK
- Click Add
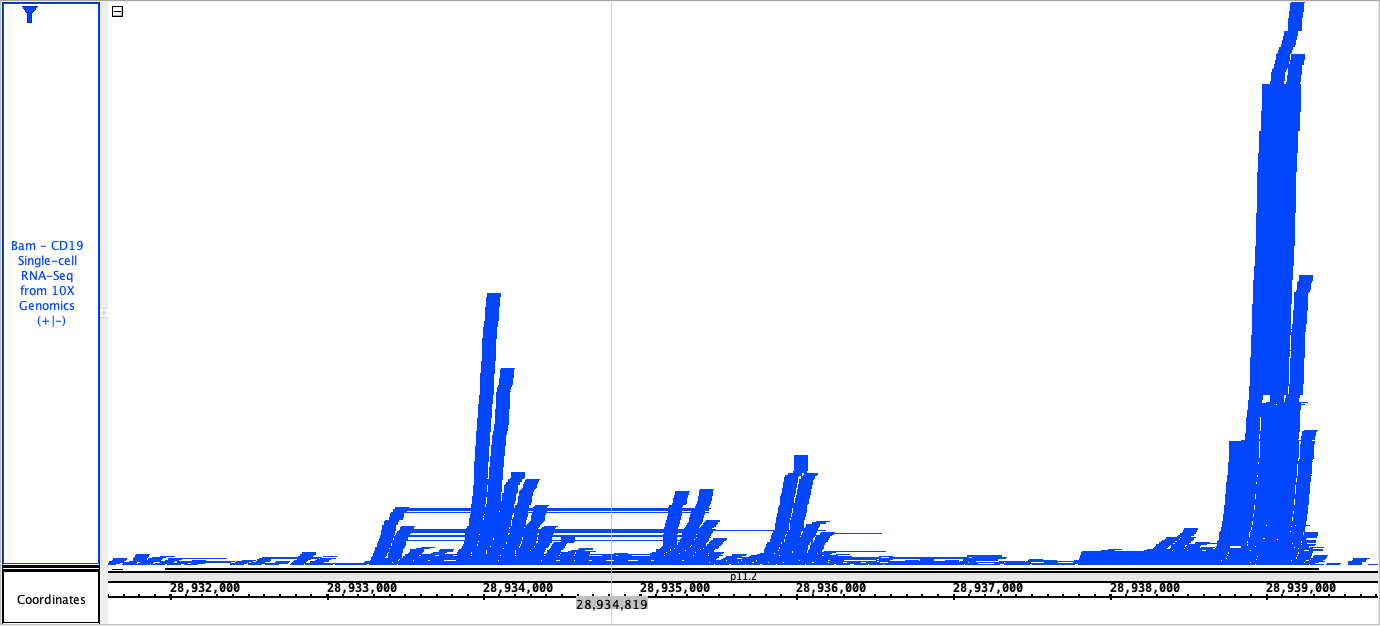
- Check that the track matches the image above.
- Mac
- Linux
- Windows
Color by...
- Right-click on the track name and select Color by...
- In the Color By window, use the dropdown to select SAMtags
- Click Configure Tag Color Mapping
- Add the following Tag Values:
- 60M30S
- 90M
- 30S60M
- Assign each row a unique color
- Check the box next to each row you added a Tag Value to
- Click Save and Apply
- In the SAMtag field, type CIGAR
- Click Save and Apply
- Add the following Tag Values:
- Click OK
- A warning appeared when Save and Apply was clicked before setting a SAMtag value.
- Mac
- Linux
- Windows
- The track matches the image above.
- Mac
- Linux
- Windows
- Right-click on the track name and select Color by...
- Click Configure Tag Color Mapping
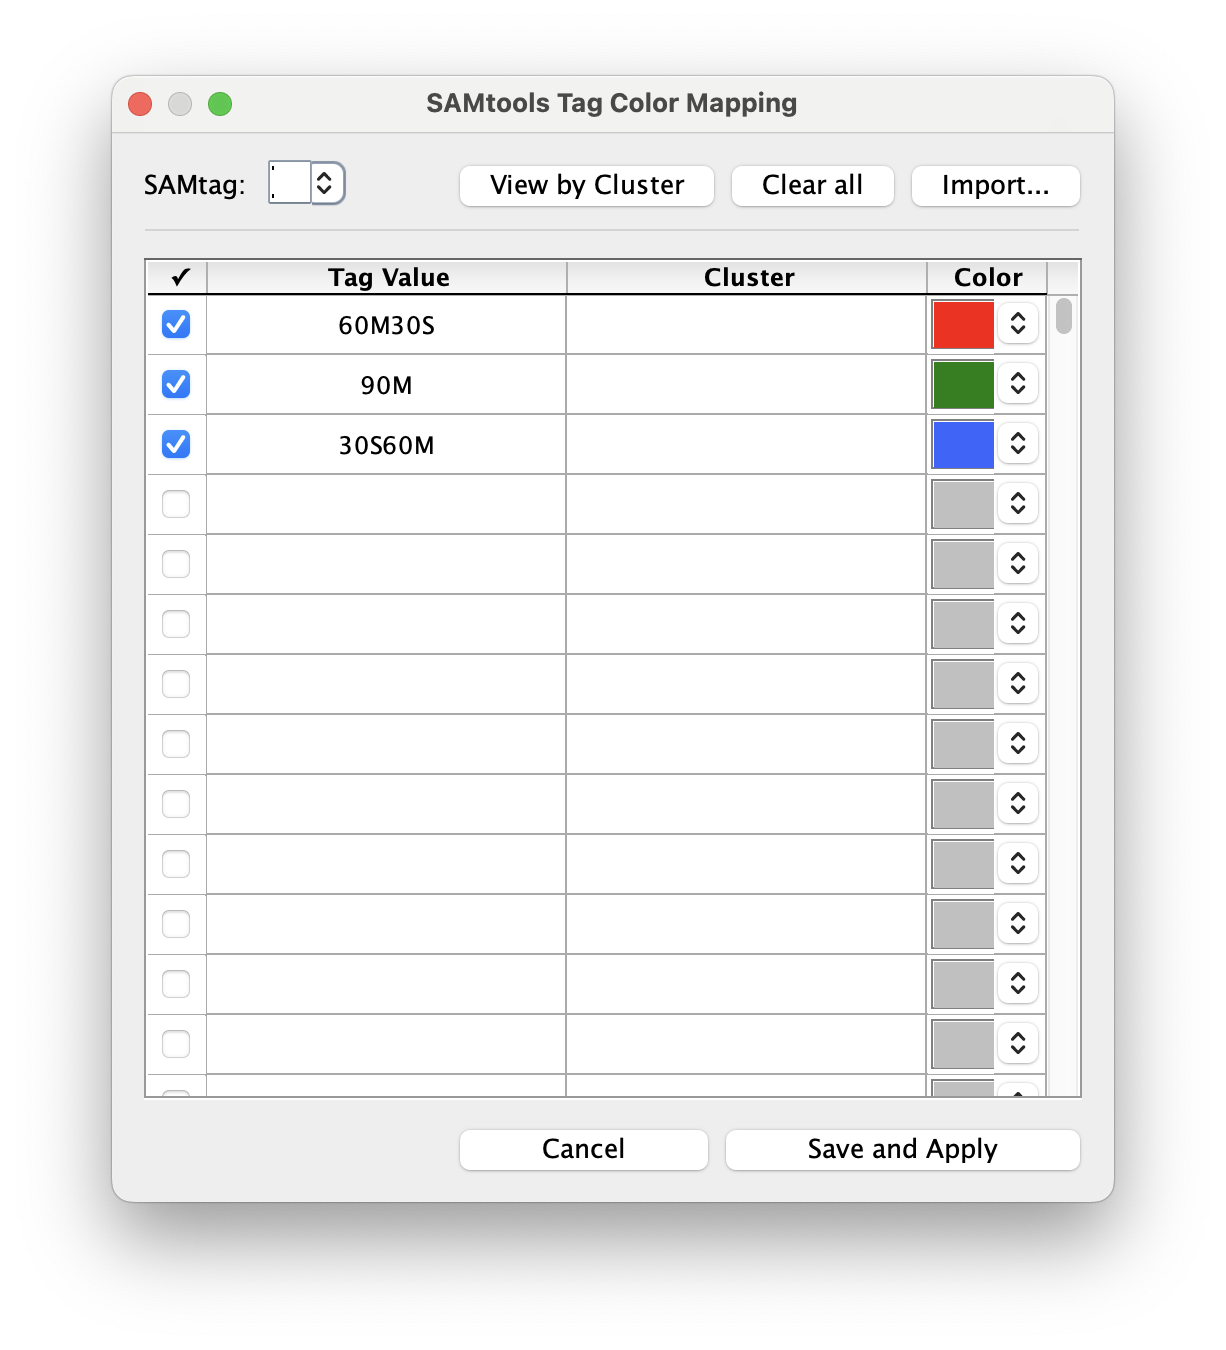
- The table still contains the tags and colors you input previously.
- Mac
- Linux
- Windows
Click Clear all
- The Color by table is now empty.
- Mac
- Linux
- Windows
- Download this CSV file from Google Drive: https://drive.google.com/file/d/1lwrytvVVnjscgp5LeHNm6NEGu4M0pwgd/view?usp=drive_link
- Click Import...
- Select the CSV file you just downloaded (10k_PBMC_3p_nextgem_Chromium_X_cloupe_withColors.csv)
- From the SAMtag drop-down menu, select CB
- Click Save and Apply
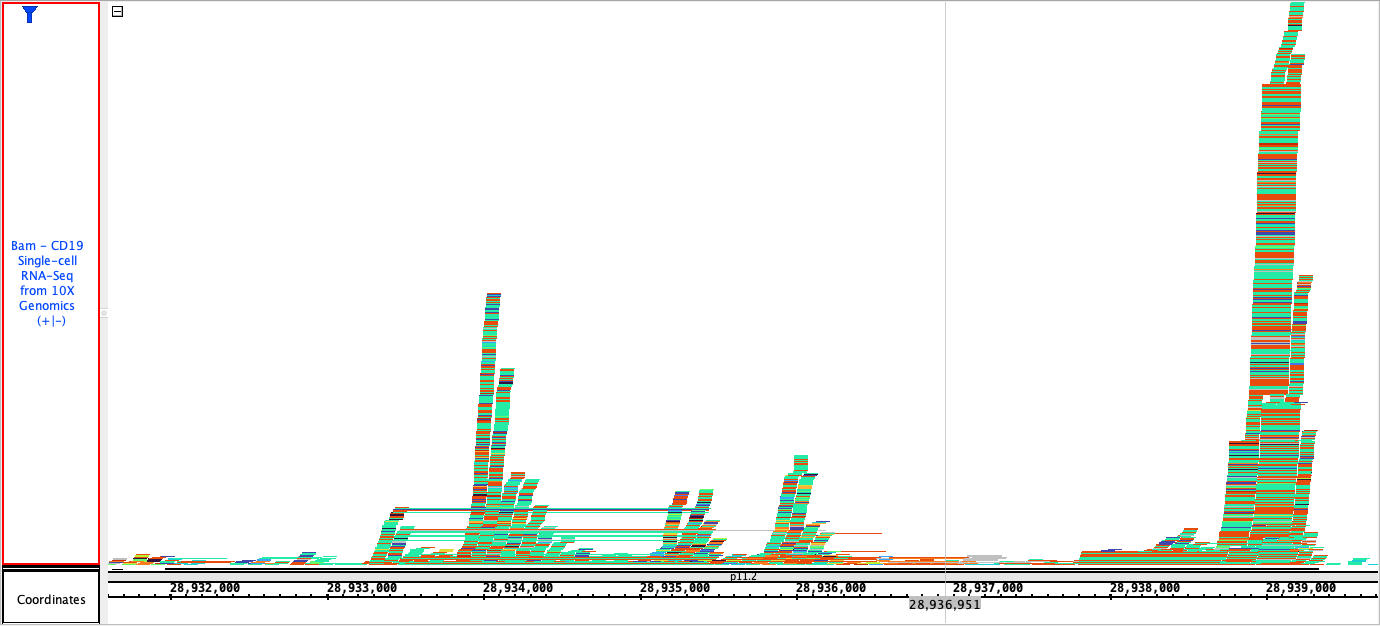
- The track matches the image above.
- Mac
- Linux
- Windows
- Right-click on the track name and select Color by...
- Click Configure Tag Color Mapping
- The Color By window appeared immediately.
- Mac
- Linux
- Windows
- Download this second CSV file from Google Drive: https://drive.google.com/file/d/1BabbrioCR_k4IW9rUX6zhvZ1VhA3vwMw/view?usp=drive_link
- Click Import...
- Select the CSV file you just downloaded (10k_PBMC_3p_nextgem_Chromium_X_cloupe.csv)
- Click View by Cluster
- Assign a unique color to each cluster
- Select CB
- Click Save and Apply
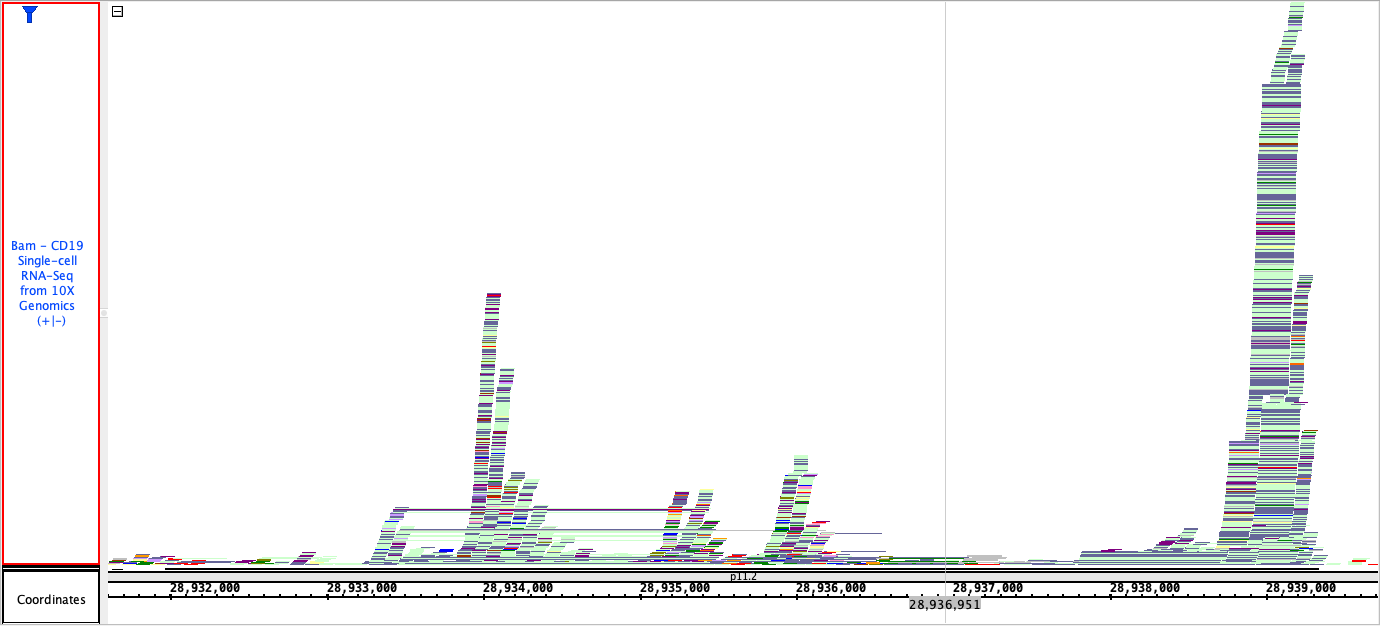
- The track looks similar to the image above.
- Mac
- Linux
- Windows
- No errors in the Log.
- Mac
- Linux
- Windows
- Open the A_thaliana_Jun_2009 genome
- Navigate to Chr1:6,709,263-6,716,866
- Check that the Araport annotation is loaded
- Right-click on the Araport track name and select Color by...
- In the Color By window, use the dropdown to select Length
- Click on the Edit button next to heatmap
- In the Configure Heatmap window, click on Set Range
- In the Set Range window, set the Min to 200 and the Max to 2000
- Click OK
- Double-click the right-most arrow
- In the Select new color window, select red
- Click OK
- Double-click the arrow to the left of the right-most arrow
- In the Select new color window, select another shade of red
- Click OK
- Click OK
- In the Configure Heatmap window, click on Set Range
- Click OK
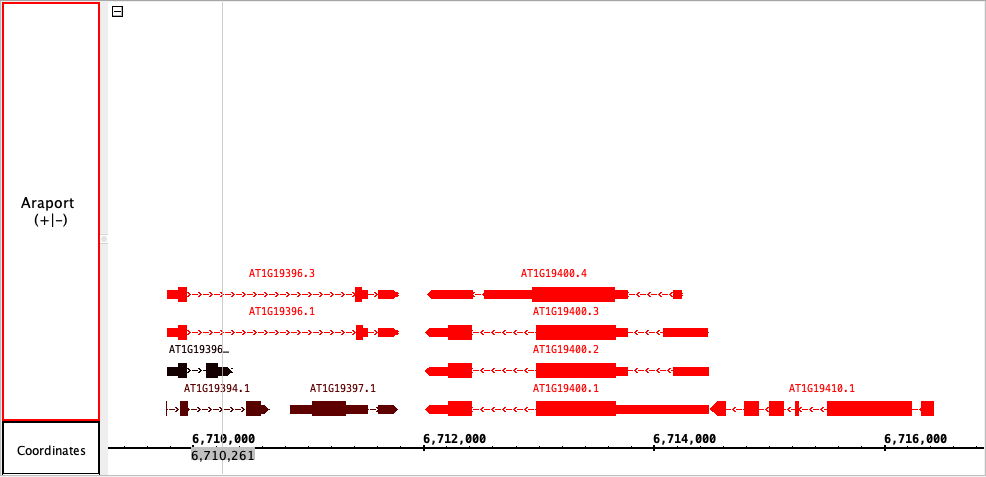
- Check that the track matches the image above.
- Mac
- Linux
- Windows
- Right-click on the Araport track name and select Color by...
- In the Color By window, use the dropdown to select None.
- Click OK
- Check that the track color is reset back to its original color (should be black).
- Mac
- Linux
- Windows