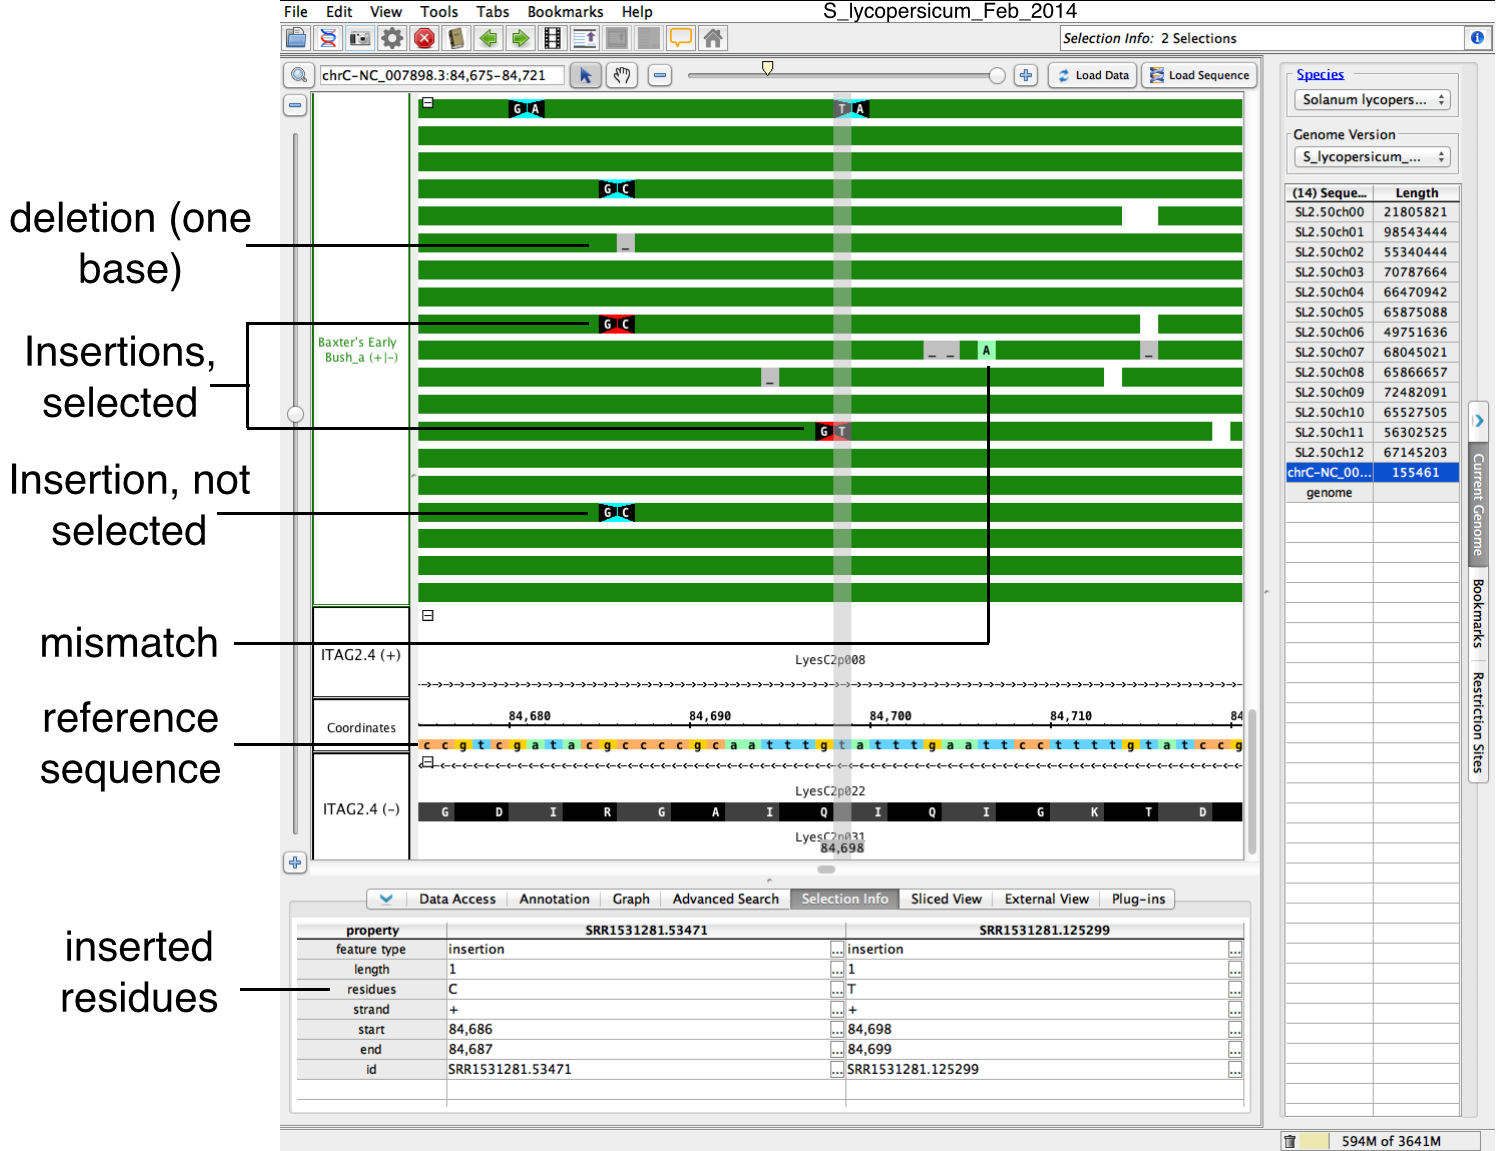
IGB displays insertions, deletions and mismatches as color-coded bases and icons on top of read alignments, as shown in the following image.
- Insertions - bases flanking insertion site appear are shown in white with a black background; triangular shapes between them point at the location of the inserted base or bases that are present in the aligned sequence but not in the reference. Select an insertion to display the sequence of inserted bases.
- Deletions - bases deleted in the aligned sequenced relative to the reference appear in gray with underscore characters
- Mismatches - bases in the aligned sequence that do match the corresponding base in the reference appear as higlighted bases. To highlight mismatches, click Load Sequence.
To re-create this scene in IGB:
- Open tomato genome S_lycopersicum_Feb_2014 (ITAG2.4)
- Select Current Genome > chrC-NC_007898.3 (tomato chloroplast genome)
- Click Load Sequence to load chloroplast genome sequence
- Zoom to chrC-NC_007898.3:72,724-102,016 (enter in Quick Search box, top left)
- Select Data Access > Available Data > Plastid Resquencing > Baxter's Early Bush_a
- Click Load Data to load alignments for Baxter's Early Bush tomato cultivar
- Expand stack height to 150 reads per track (right-click track and select Set Stack Height)
- Use vertical zoomer to stretch read alignments vertically
- Enter chrC-NC_007898.3:84,675-84,721 in Quick Search box to zoom to region