Introduction
Starting with IGB version 6.3, you can use IGB to visualize sequence alignment files alongside annotations and genome sequence.
IGB supports visualization of alignment files in
- BAM format (binary alignment format)
- SAM format (plain text version of BAM)
- PSLX format (output from the blat alignment tool)
- VCF (variant call format)
As with other file formats, IGB can open files from your local hard drive, from a Web site, or from a Quickload data source.
If you are loading BAM alignments from a Web site, IGB will first download your index (BAI) file and then use it to determine which part of the much larger BAM file to download whenever you click the Load Data button.
Each BAM file requires an index file (BAI) located in the same location (same folder, same website, etc.) as the BAM file. SAM files do not require indexes.
Open short-read alignment (BAM or SAM) file
If your species and genome version of interest are available, first select it using menus in the Current Genome tab or click a species shortcut image on the IGB start screen.
Next, open the file. You can open a file in IGB by
- using File > Open File menu (allows you to enter a custom species and genome)
- using File > Open URL.. menu
- click-dragging from your desktop into the IGB window
- click-dragging a URL from a Web page
- or loading from a QuickLoad server
When you first open a BAM file, a new empty track will appear in the main IGB window, labeled with the name of the file or the name of the data set if loaded from an IGBQuickLoad site.
A new row representing the newly opened file or data set will also appear in the Data Management Table in the Data Access tab.
If your genome of interest is not available, you can enter it in the file chooser window.
Set the load mode (optional)
Manual (the default)
When you first open a BAM file, its Load Mode will first be set to Manual, meaning that to load the data into IGB, you click the Load Data button. Also, only data for the currently shown region will load into IGB.
Before clicking the Load Data button, first zoom in to a region or search for a gene of interest.
Attempts to load data for large regions will prompt a warning from IGB.
Since alignment data sets are typically very large, it is a good idea to only load a few genes' worth of data, depending on the file and the experiment.
Auto
The Auto load mode setting triggers automatic loading of data when the display is zoomed in past the Autoload threshold, indicated by the yellow marker on the horizontal zoom control.
Drag the horizontal zoom control to the right of the Autoload marker to activate automatic loading of data sets.
To change the Autoload threshold to the current zoom level, choose View > Set Autoload Threshold to Current View
Zoom in on a region and load data
- Use the slider, double-click a gene model, run a search, or click-drag the sequence axis to zoom in.
- Click the Load Data button to load data into the display.
IGB will then load data for the currently visible region.
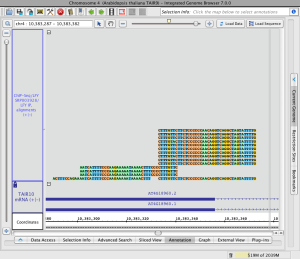
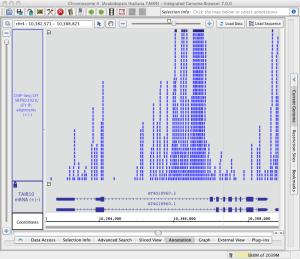
If genomic sequence data have not already been loaded for the current region, IGB will show the sequence bases of reads when zoomed in, as in the image below.
Read alignments (click to enlarge)
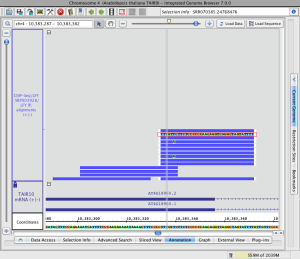
Load sequence data to view mismatches
To view just mismatches between reads and the reference genome
- Click Load Sequence in View in the upper right corner of the IGB display
This will trigger loading of genomic sequence and allow IGB to show just the mismatches rather than the full sequence of each aligned read.
Read alignments with mismatches (click to enlarge)
To restore read sequence
- Right click a read and select Restore Read Sequence.
Read alignment with read sequence (click to enlarge)
Adjust stack height
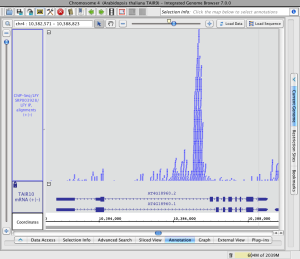
Note that in the image below showing read alignments from a ChIP-Seq experiment, there is a row of reads at the top of the track which appear darker than the rest. The darker row indicates there is some number of reads that are not being shown because they exceed the current stack height setting for the track.
The darker row of reads in the top row of the track are called the "summary row." To count them, click-drag the arrow cursor over the summary row. In this case there are more than 1,000 reads in the summary row.
The number of rows shown below the summary row is determined by the stack height setting. To change the stack height setting
- Right-click a track label and choose Set Stack Height or Optimize Stack Height
Read stack with reads in the summary row (click to enlarge)
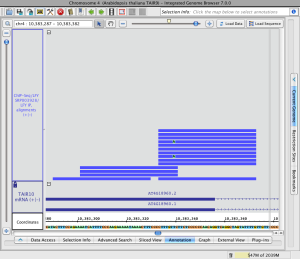
The image below shows the same scene as in the image above after using the Optimize Stack Height feature. Note that the height of the annotation track (TAIR10 mRNA) is locked to ensure that increasing the read track's stack height would not affect the annotation track's height, which is set to 100 pixels.
Read stack with all reads showing (click to enlarge)