...
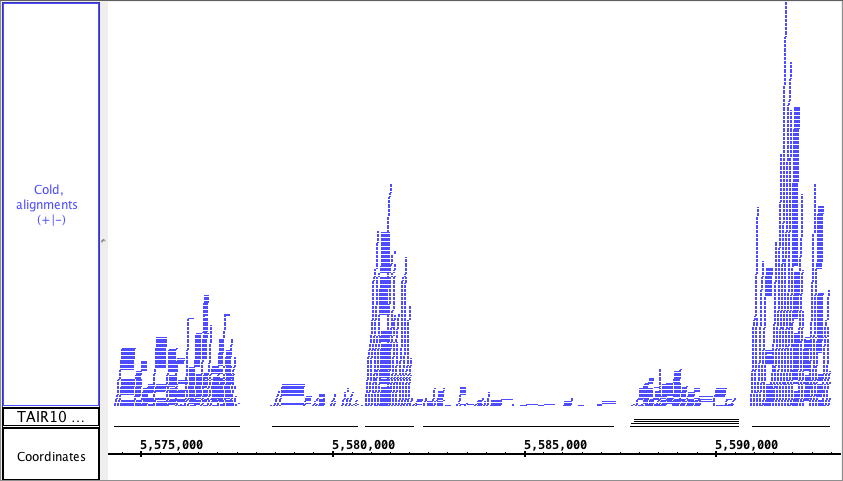
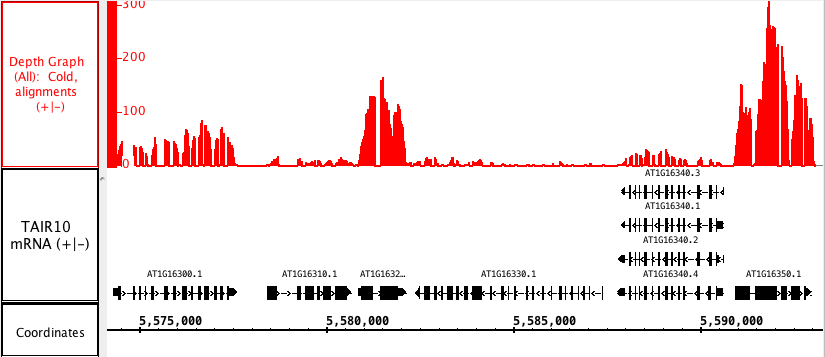
The picture below shows a fully expanded BAM file, showing the difficulty of seeing any details. The second picture shows just the depth graph (*BAM *track is 'hidden').
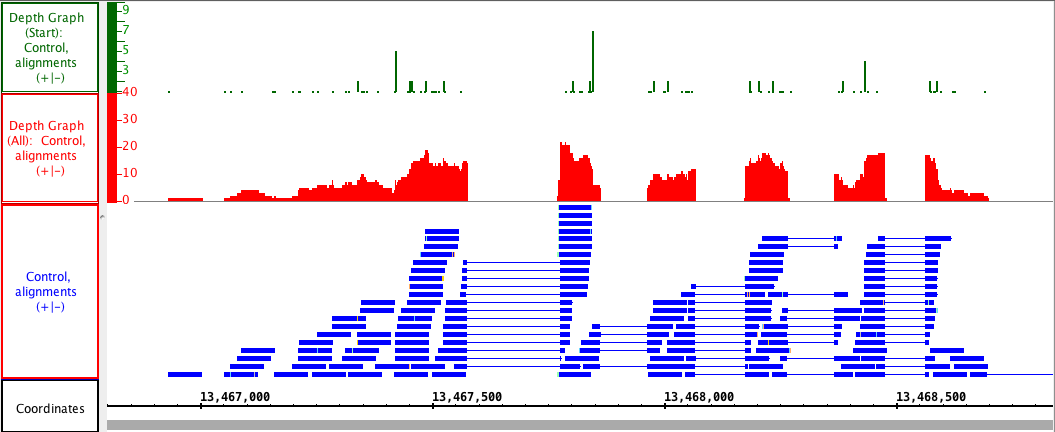
Depth Graph (Start)
Depth Graph (Start) only graphs the first nucleotide of each read. This is most useful when assessing coverage bias in RNA-Seq or other high-throughput sequencing experiments. Often some regions are better represented than others, thanks to PCR amplification bias or other artifacts.
Mismatch Graph
The Mismatch graph is specific to short read alignment files, such as BAM. The graph shows only the number of mismatched nucleotides across all reads at a specific genomic location, which can be very helpful in the detection of allelic variation, SNP identification and also error checking. Right click in the label to access the menu; choose Track Operations > Mismatch Graph. This function requires that the genomic sequence be loaded; if it is not loaded, IGB will load the sequence for you.
...