...
In the Mismatch Pileup, you have the Depth Graph portion represented as a dark gray graph, with the Mismatch Graph overlayed in the matching nucleotide colors. The colors show which and how many of each nucleotide(s) are present at each mismatch position. The Mismatch Pileup graph, like the Mismatch graph Graph, is also specific to short read alignment files, such as BAM. Right click in the label to access the menu; choose Track Operations > Mismatch Pileup Graph. This function requires that the genomic sequence be loaded; if it is not loaded, IGB will load the sequence for you.
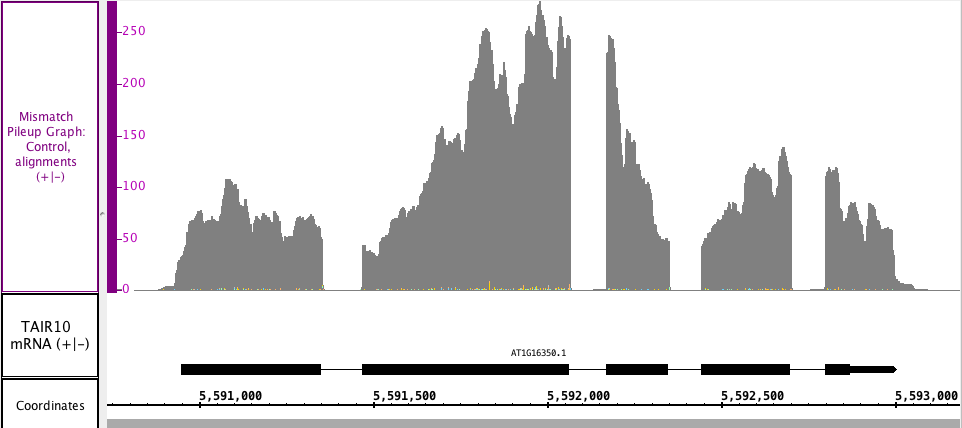
In the image below, you can see the gray depth portion matches the Depth graph Graph from above, but you can also see the mismatched nucleotides (very small numbers in this section), which are color coded by G, A, T and C.