...
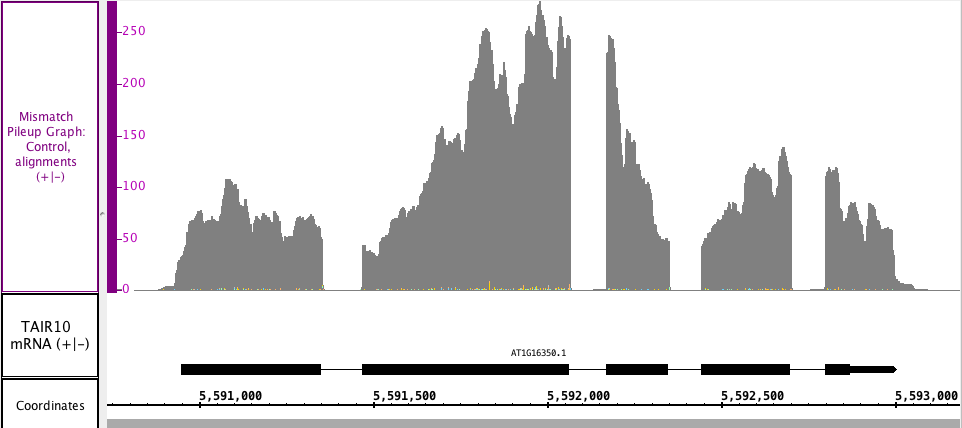
In the image below, you can see the gray depth portion matches the is a Depth Graph from above, but you can also see the mismatched nucleotides (very small numbers in this section), which are color coded by G, A, T and C.
...
In the image below, you can see the gray depth portion matches the is a Depth Graph from above, but you can also see the mismatched nucleotides (very small numbers in this section), which are color coded by G, A, T and C.