...
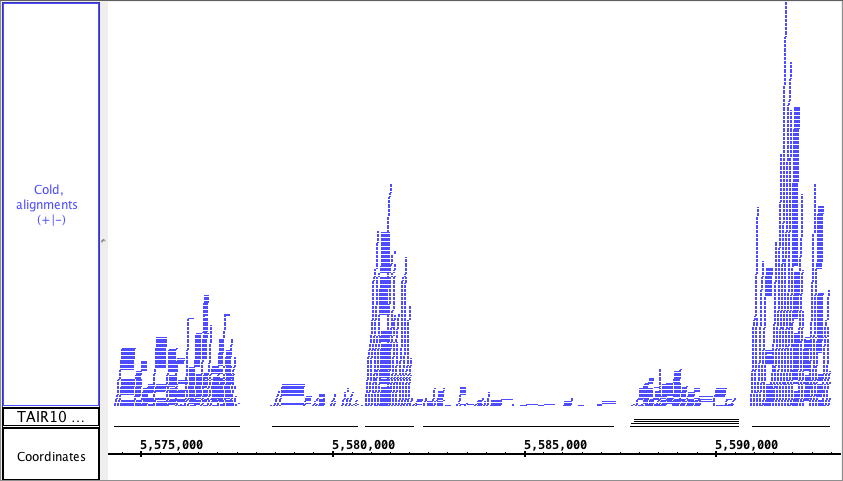
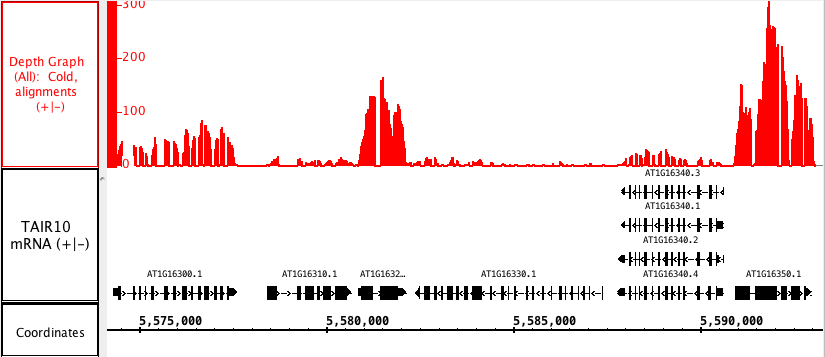
The picture below shows a fully expanded .bam file, showing the difficulty of seeing any details. The second picture shows just the depth graph (.bam track is 'hidden') with the tool tip showing the number of reads aligned onto that specific genomic location.
Mismatch Graph
The mismatch graph is specific to short read alignment files, such as .bam. The graph shows only the number of mismatched nucleotides across all reads at a specific genomic location, which can be very helpful in the detection of allelic variation, SNP identification and also error checking.
...
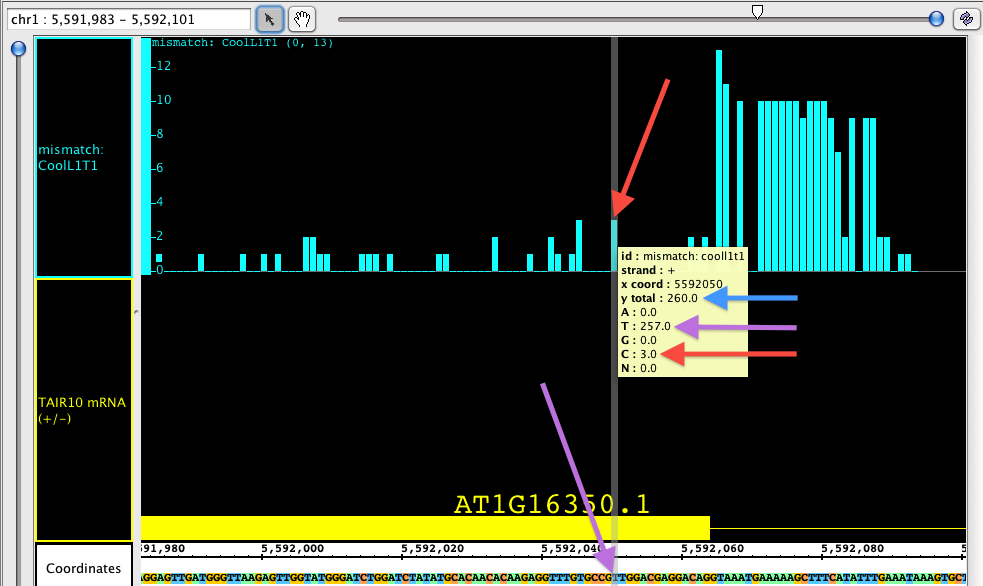
In the picture below, you can see that the total number of reads at the specified position is 260 (blue arrow). Of those reads, 257 at at 'T', which you can see is the matching nucleotide (purple arrows). 3 of those reads contain a 'G' instead; since G is a MISmatch, the graph shows a bar with height of 3 (red arrows).