...
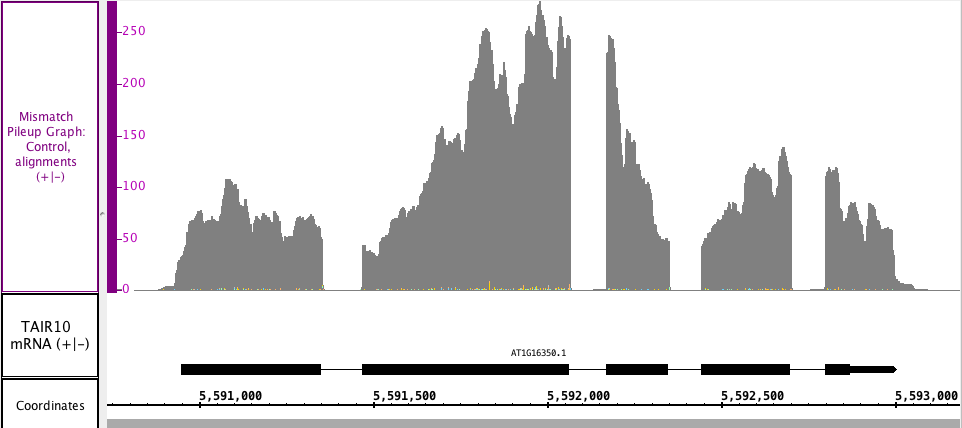
In the image below, you can see the gray depth portion matches the Depth graph from above, but you can also see the mismatched nucleotides (very small numbers in this section), which are color coded by G, A, T and C.
...
In the image below, you can see the gray depth portion matches the Depth graph from above, but you can also see the mismatched nucleotides (very small numbers in this section), which are color coded by G, A, T and C.