...
Graphs can be created by right-clicking on a track's label and highlighting Track Operations. A list of graphs and other track operations compatible with the track will then be displayed. The track operations that create graphs are:
| Table of Contents |
|---|
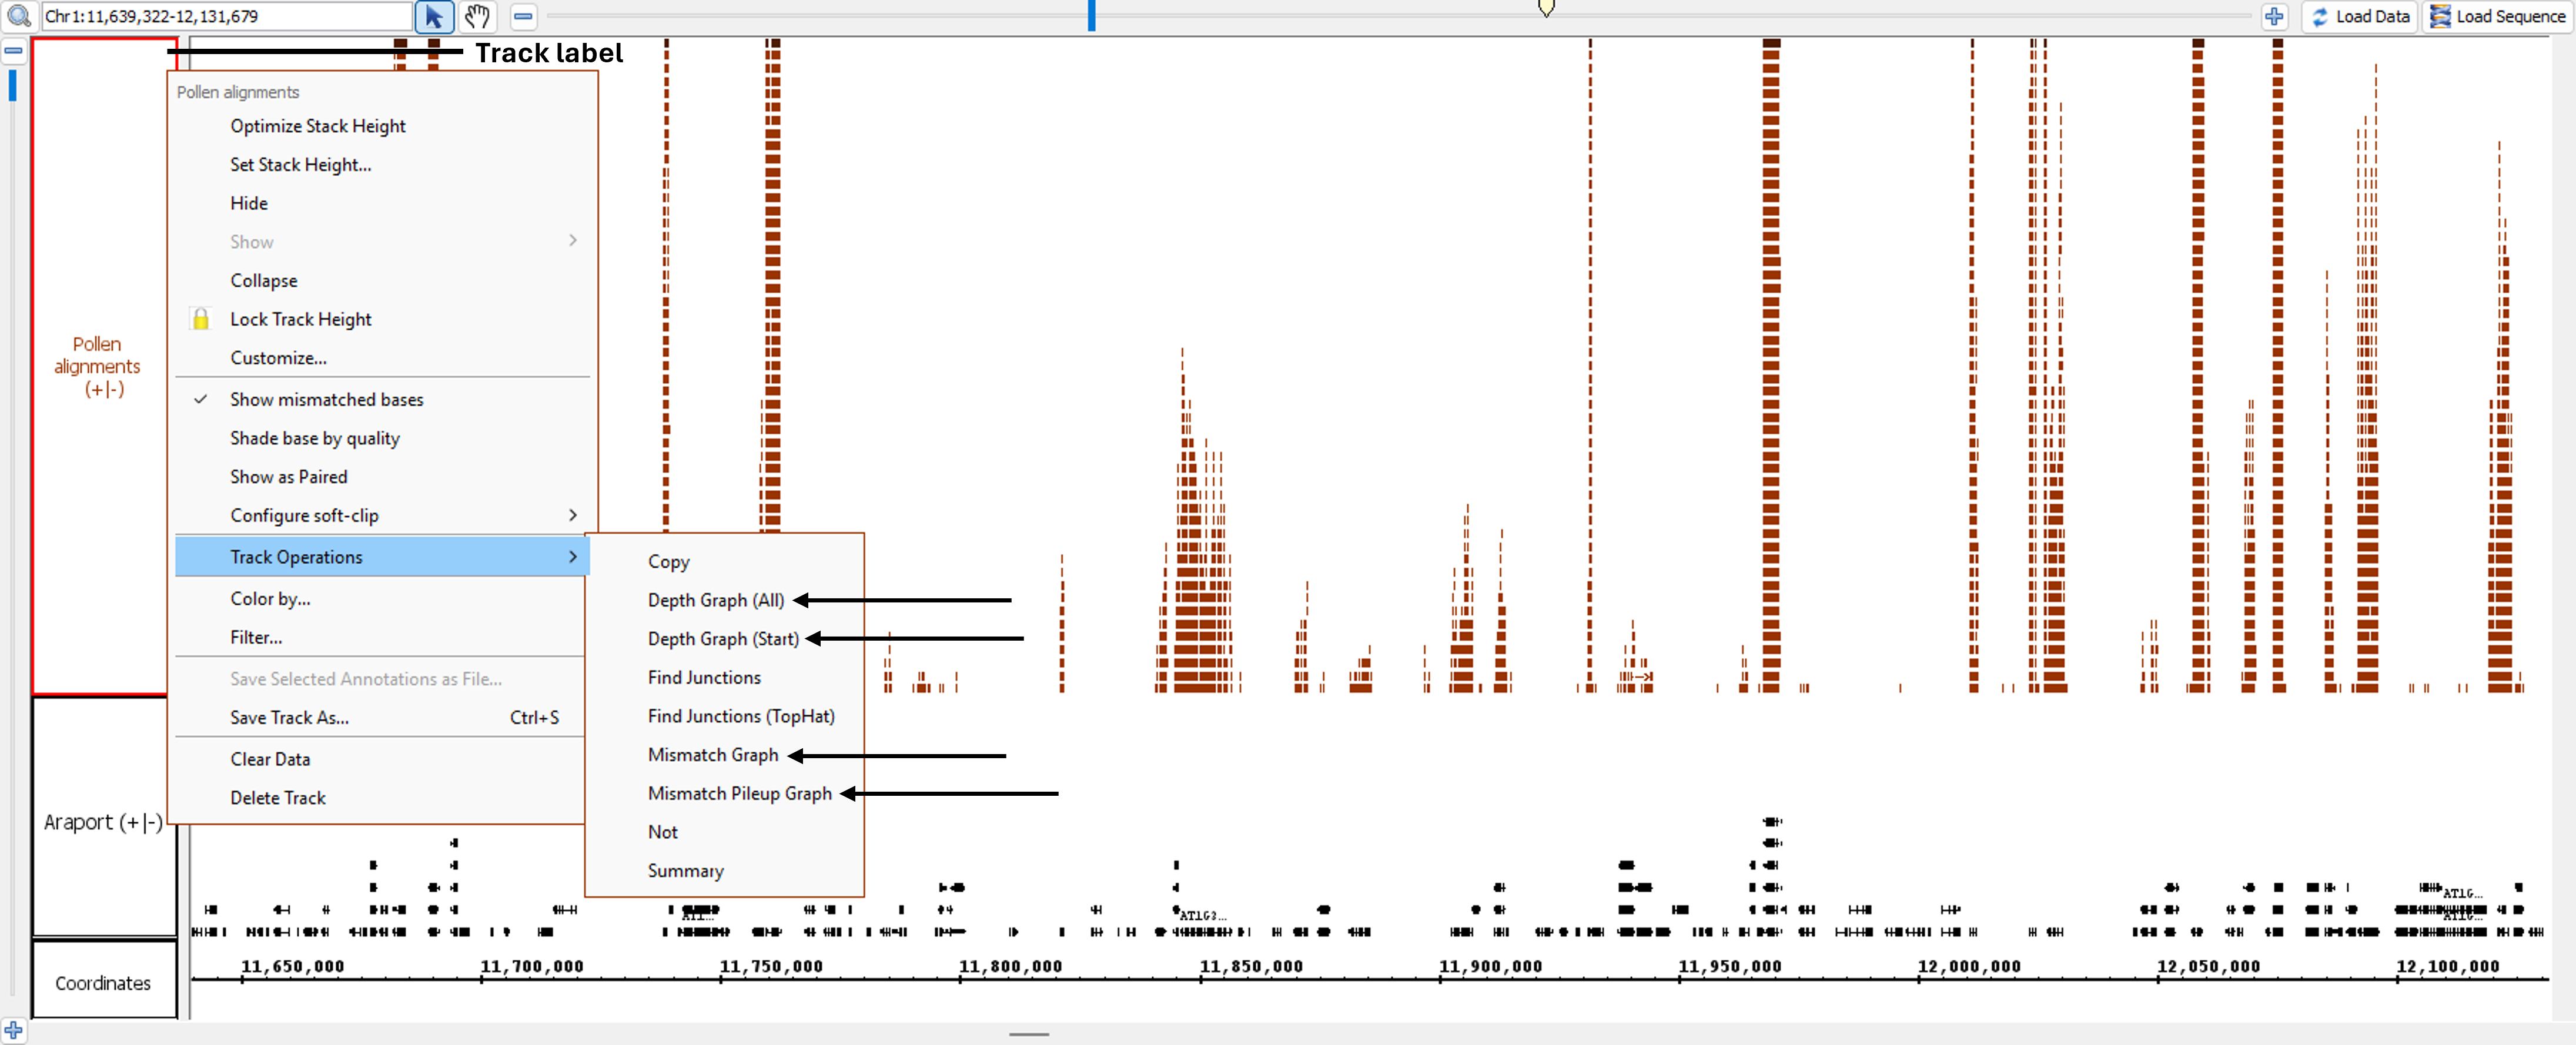
After these graphs are created, click Load Data to load graphs for regions that have not yet been loaded. Graph tracks may be saved as .wig formatted files.
...
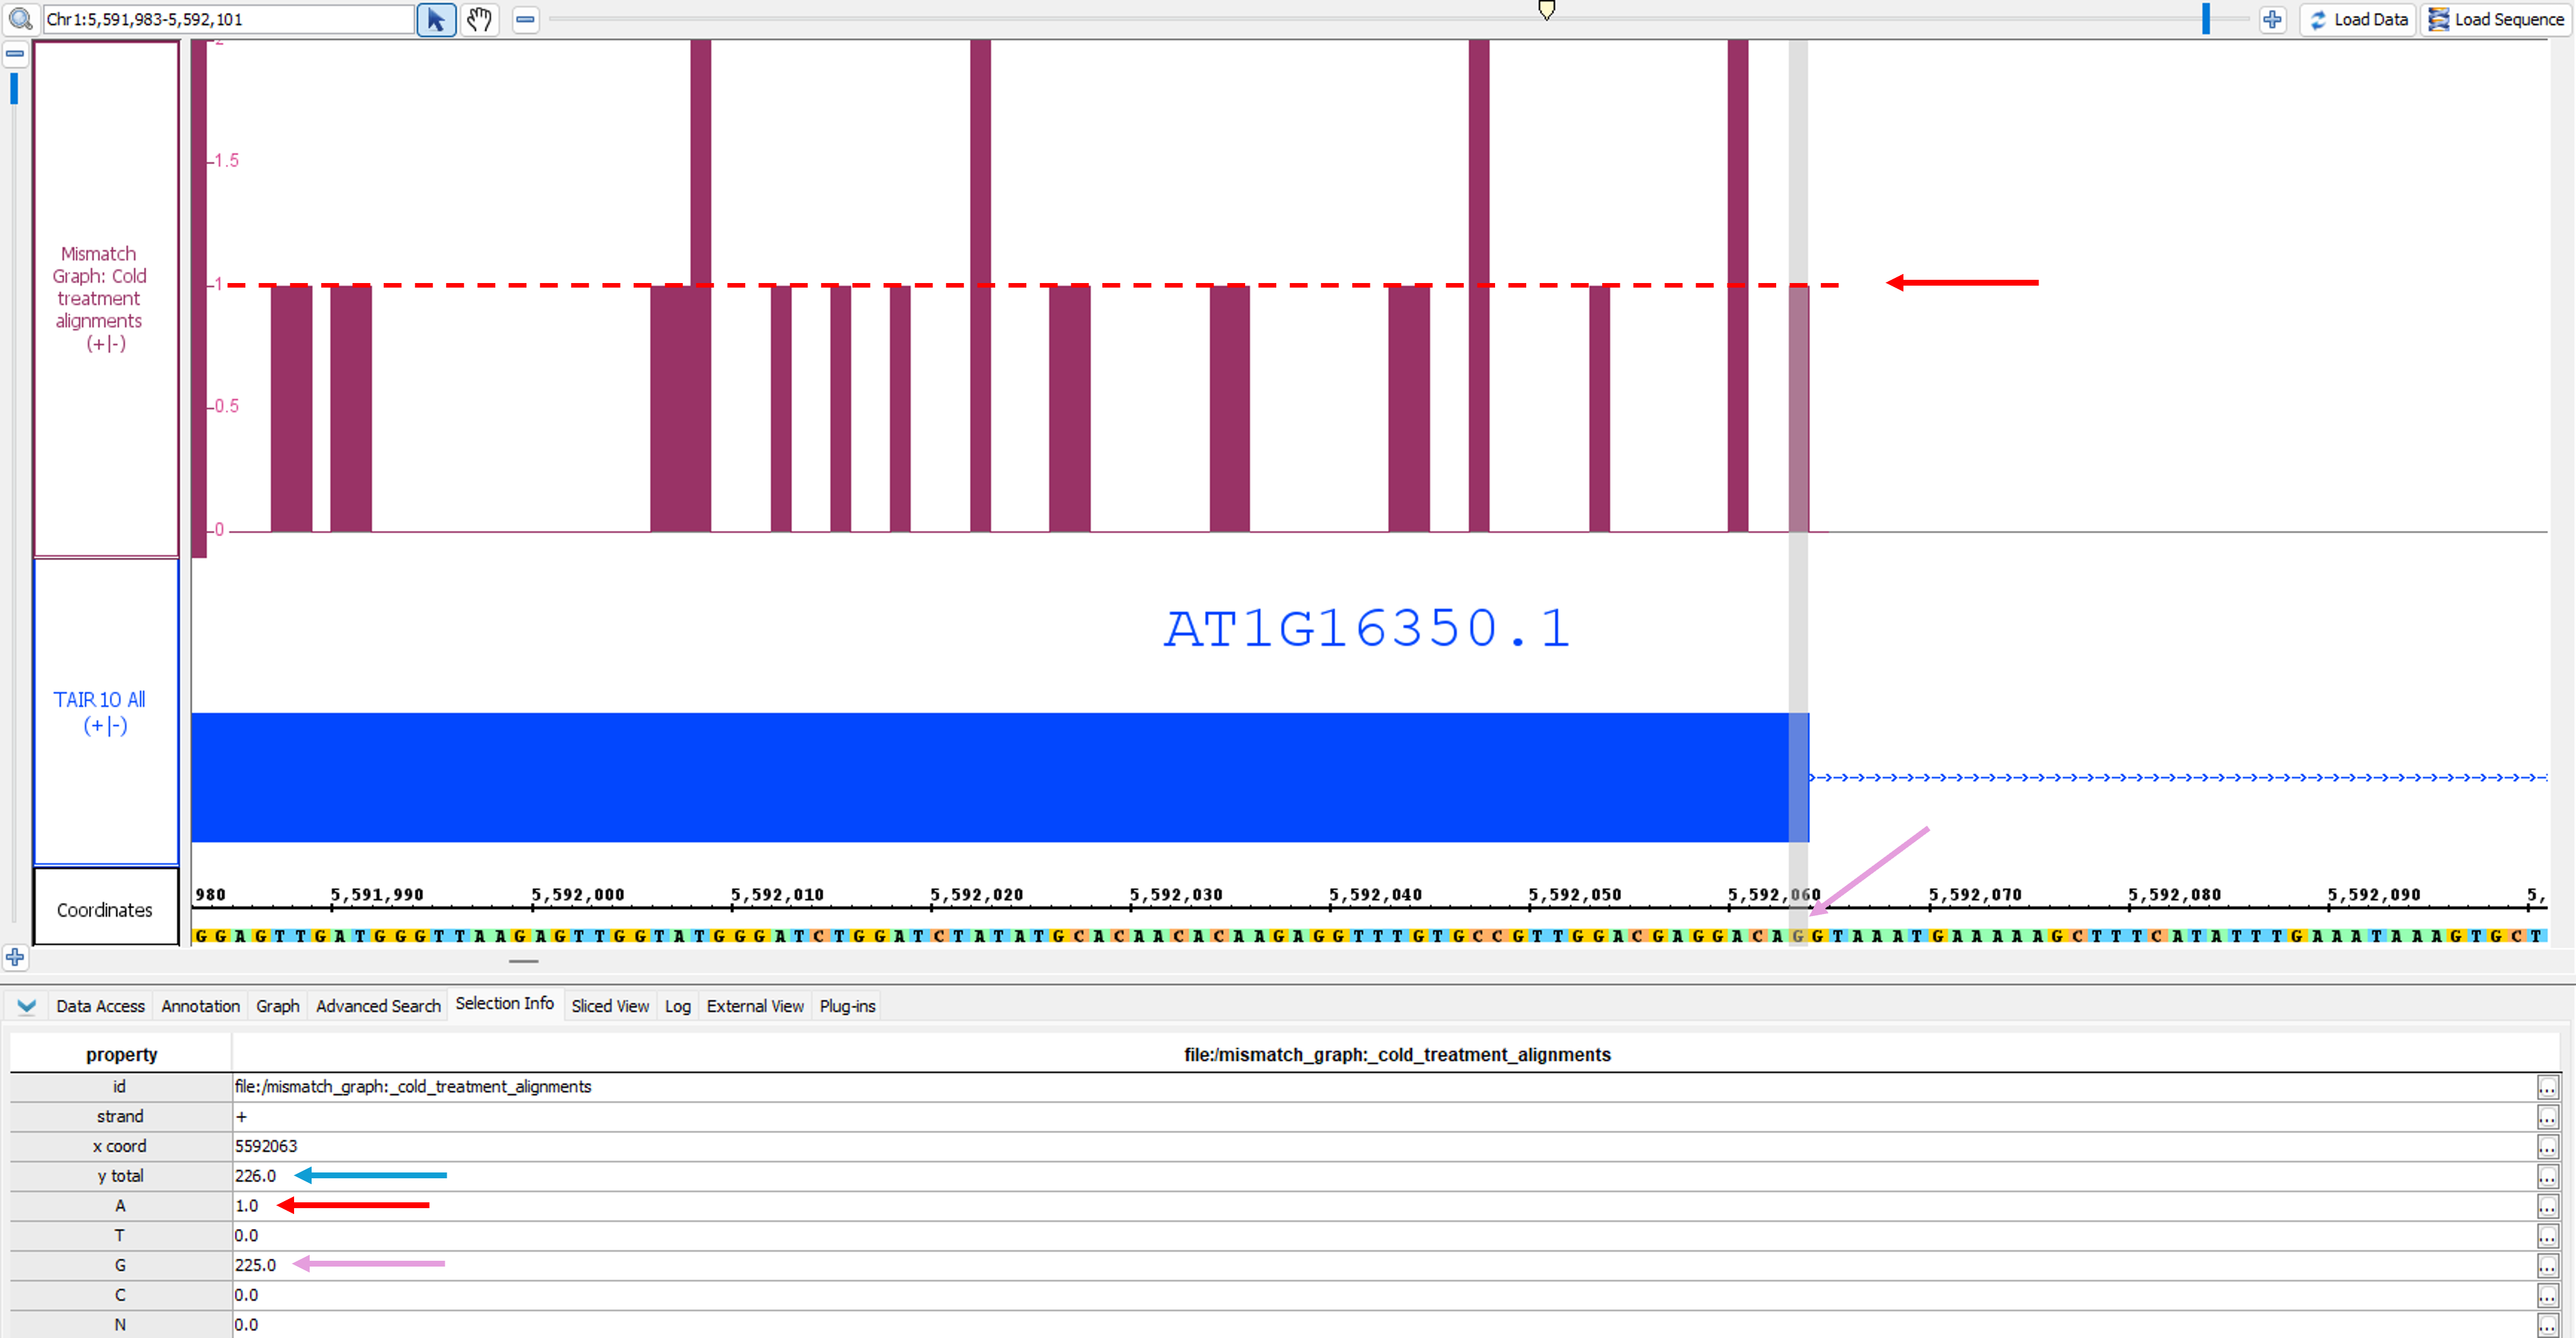
If you click on any individual bar of the graph and then open the Selection Info tab at the bottom of IGB, you will get a table showing the total number of reads as well as the number of reads broken down by nucleotide at that position. In the picture below, you can see that the total number of reads at the specified position is 226 (blue arrow). Of those reads, 225 have a 'G' at that position, which you can see is the matching nucleotide in the coordinates track (purple arrows). One of those reads contains an 'A' instead; since A is a mismatch, the graph shows a bar with height of 1 (red arrows).
Mismatch Pileup Graph
...