Introduction
IGB offers many options to customize the appearance of annotation tracks.
IGB remembers your customizations from session to session.
Some of the available customizations include:
- Annotation color
- Track background color
- Track label text, color
- Track height (pixels)
- Annotation stack height
- Annotations labels (e.g., using score or gene name)
- Changing track height and position in the display
- Changing strandedness of the tracks
- Changing the amount of data shown within the track (Stack Height)
You can change appearance of annotation tracks
- By clicking Annotation tab
- By right-clicking a track label and selecting Customize...
- By opening File > Preferences > Tracks
You can also set the default values for newly opened tracks based on file type using the Track Defaults tab in the Preferences window.
Track Colors
In IGB you can modify the color schemes for annotation and graph tracks. Using controls in the Annotation and Track Preferences tabs, you can
- change annotation and graph colors (foreground, FG)
- change background color (BG)
- change the color of the track labels
Unless you change it, the track label font color always matches the foreground color.
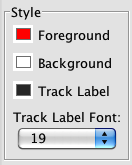
The following images shows the Style settings from the Annotation tab for a selected track. Note that the track label outline is red, indicated the track is selected.
Track label text
All annotation tracks have a track label in the panel on the left side of the display. You can change several aspects of how the label appears. You can
- change the text (called the "display name") displayed on the label
- change the track label text font size and color
To change the text in a track label, select the track by clicking its track label and
- choose Preference > Tracks tab and enter new text under the Track Name column
- or choose the Data Access panel and enter new text under the Track Name column in the Data Management Table
To change the track label font size, select the track by clicking its track label and
- choose Preferences > Tracks and enter a new value using the Track Label Font menu
- or choose the Annotation tab and enter a new value in the Style box
Track label width
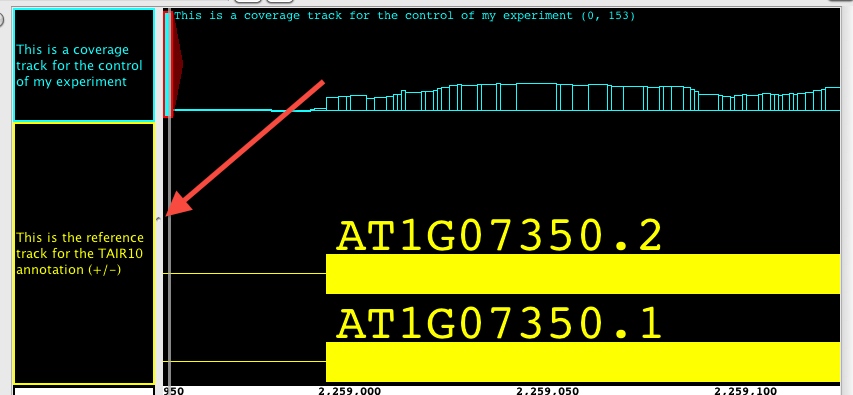
You can also change the width of a track label. To increase or decrease track label width, drag the vertical bar that separates the labels from the data. The red arrow in the image below shows the 'grab point' which can be used to change the label column width.
Edge Match color
If you use white or light gray shades for backgrounds, you may want to change the color of the Edge Match graphics so that it is easier to see.
To change the edge match color
- Open File > Preferences > Other Options
- Click on the swatch labeled Edge Match Color
Edge matching examples (click to enlarge)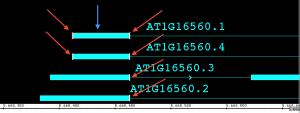
Annotation labels
Every annotation has a set of associated attributes, such as its ID, score, name, gene name, description, start and end positions, and so on.
You can configure IGB to display any one of these attributes next to an annotation.
To change what values are shown as the annotation label
- Select the track by clicking its track label
- Click Annotation tab
- Choose an option in the Label Field menu
Choose score field for junction BED files created by TopHat
Strand controls
Combine or separate plus and minus strand annotations
IGB can show plus and minus strand features in separate tracks or combined into one track. To combine plus and minus strand annotation into a single track
- Select the track by clicking its track label
- Click Annotation tab
- Click +/- checkbox in the Labels and Strand sub-panel
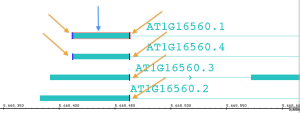
Use Arrows to indicate strand
IGB can draw arrows within introns that indicate strand. To use arrows to indicate strand
- Select the track by clicking its track label
- Click Annotation tab
- Click Arrow checkbox in the Labels and Strand sub-panel
Use color to indicate strand
IGB can indicate annotation strand using color. To turn this option on or off or choose colors to use for minus and plus strand feature
- Select the track by clicking its track label
- Click Annotation tab
- Click Color by Strand checkbox in the Labels and Strand sub-panel
- Select colors by clicking the Color by Strand swatches
Collapsing and expanding tracks
Collapsing a track merges all annotations in the track into a single row.
To collapse a track
- Right-click the track label and choose Collapse
- Or click the collapse track icon in the top left corner of the track
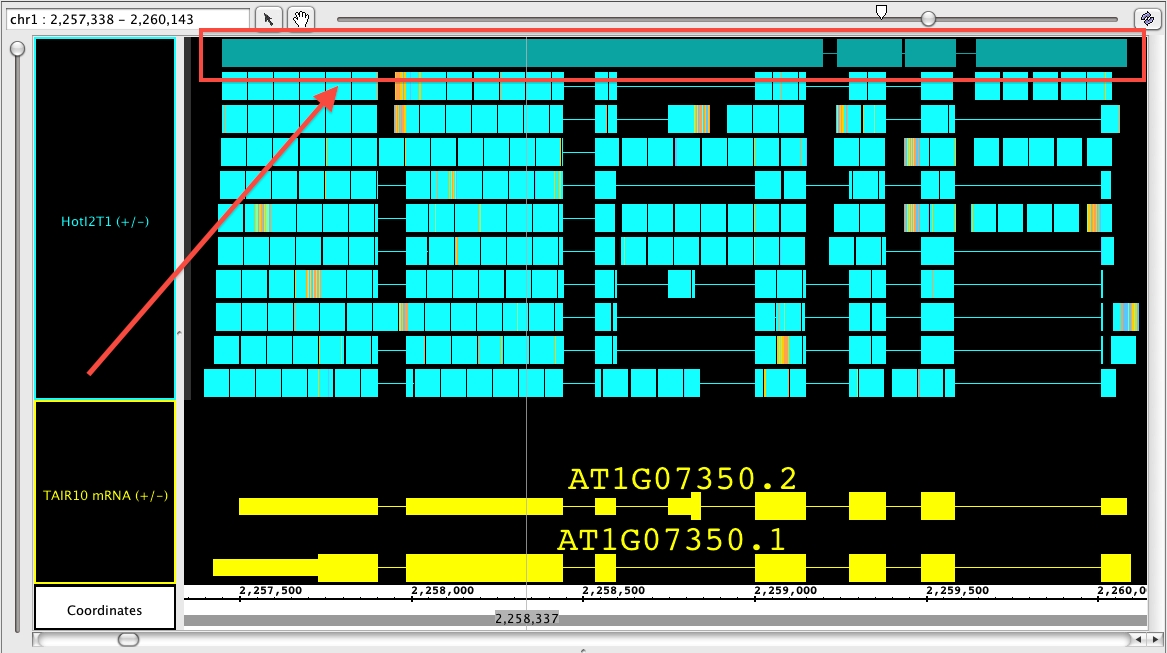
Stack height
The stack height setting controls the number of annotation rows that appear within a track. If there are more annotations than can be shown, IGB draws these in a single summary row in the top or bottom row of the track, depending on whether plus or minus strand features are being shown.
To change stack height, right-click the track label and
- choose Set Stack Height
- choose Optimize Stack Height to set a value that is optimal for the current view, e.g., ensure that all annotations will be drawn individually as part of a stack
or
- Select the track by clicking its track label
- Click Annotation tab
- Enter a value in the Stack Height field and click Go, or click Optimize
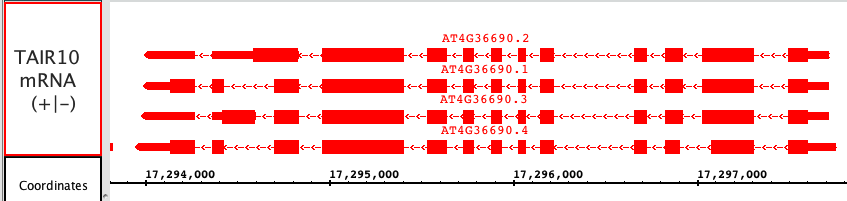
In the image below, the Stack Height is set to 10. The red arrow points to the summary row.
Using color to represent scores
For annotation data that contains scores, IGB can display the data with color intensity reflective of the scores. The scores must have been included in the data when it was loaded. Files in GFF and BED format allow the specification of scores.
To turn color-by-score on or off
- Right-click the track label
- Select Color by... to open the Color by dialog
- Choose Score from the drop-down menu
- Click OK
This function has no effect on data that doesn't contain scores.
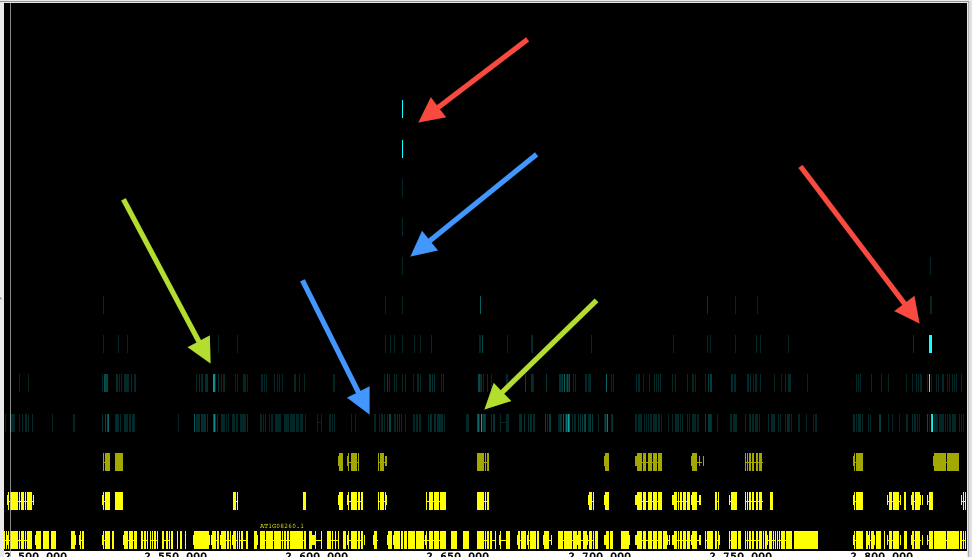
The default range that IGB uses is 0 to 1000+, but this range can be modified to better display data. You can set the lower value so that any data with a score below your threshold will be barely visible; you can set the upper score to the highest score in your data, or any other value. After setting the lower and upper values, IGB will scale the color intensity across the new range so that the highest values are most intense, and the lowest values are the least intense (see image below).
To modify the default color-by-score range
- Right-click the track label
- Select Color by... to open the Color by dialog
- Choose Score from the drop-down menu
- Click Edit
- Click Set Range
- Enter a new min and/or max values(s)
- Click OK
In this image, exons are the scored value. Exons with the highest scores will display in the chosen foreground color (red arrows). Exons with the lowest scores will display in a color intensity that blends with the background color (blue arrows). All other scores will be displayed at color intensities associated with their numerical score, where mid range numbers will show with mid range color intensity (green arrows).