Graph Track Operators
Be sure to look at the user guide pages linked here. Skim them to make sure that the topics they cover are represent here (if not add points here as needed). Read enough to ensure that the instructions and explanations are clear, and the page has accurate information and generally appears up-to-date.
See Users Guide pages:
Add the Even Numbers test file
Get the graph track operations test file. There is probably a copy in the code base in the test sources in the Track Operations module.
You can just paste this into a text file, or download it from here: TrackOperationsTesting1.bedgraph
# genome_version = A_thaliana_Jun_2009
track type=bedgraph name="TrackOperationsTesting1" description="Even numbers" color=0,128,0
Chr1 0 245144 0
Chr1 245144 735432 2
Chr1 735432 1470864 4
Chr1 1470864 2206296 8
Chr1 2206296 3186872 16
Chr1 3186872 3922304 20
Chr1 3922304 4412592 14
Chr1 4412592 4657736 20
Chr1 4657736 5148024 10
Chr1 5148024 5393168 6
Chr1 5393168 5638312 6
Chr1 5638312 5883456 4
Chr2 0 245144 2
Chr2 245144 490288 2
Chr2 490288 735432 2
Chr2 735432 1225720 4
Chr2 1225720 1470864 4
Chr2 1470864 1716008 8
Chr2 1716008 2206296 8
Chr2 2206296 186872 16
Chr2 3186872 3922304 20
Chr2 3922304 4167448 14
Chr2 4167448 4412592 0
Chr2 4412592 4657736 20
Chr2 4657736 4902880 10
Chr2 4902880 5148024 10
Chr2 5148024 5393168 6
Chr2 5393168 5638312 0
Chr2 5638312 5883456 0
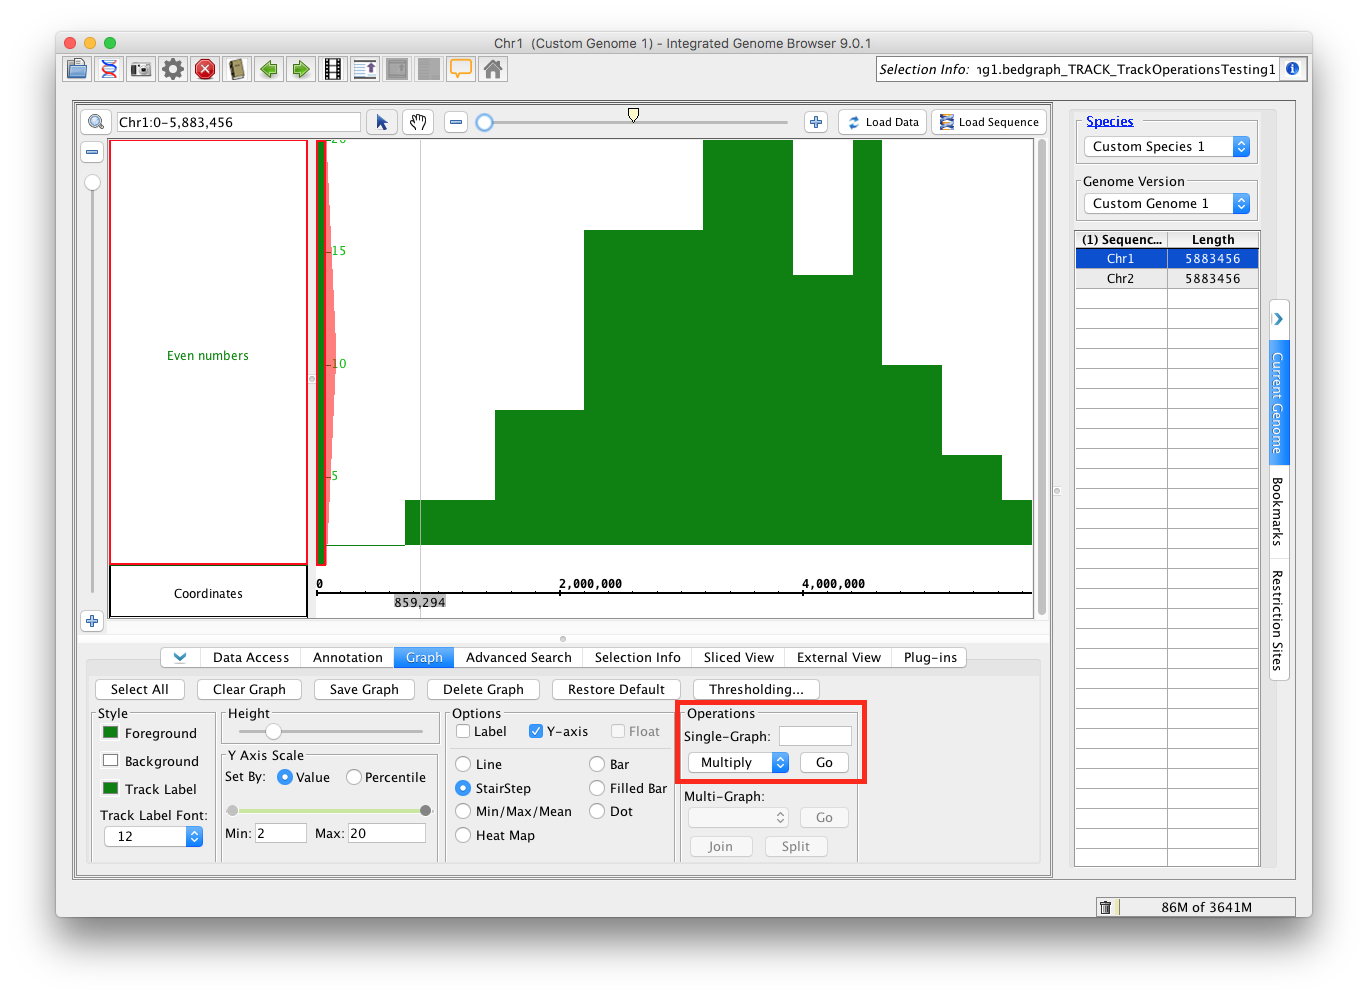
Add the track operations test file. You can do this without selecting any genome, just drag/drop the file onto the home screen. Change the Load Mode to Genome. In the Graph panel, under Options, select StairStep.
| Warning |
|---|
You may need to adjust the y-axis scale for each graph track. |
Single Track Operations - part 1 - add and subtract
Go to the Graph panel, and select the Even Numbers track.
- Under Operations, under Single-Graph, select Add. If there was not already a box to enter a value, one should appear. Enter 1 and hit "Go". This should create a new track, with yellow highlight around the track label. Enter 2 and hit "Go". This will create another new track.
- Mac
- There is a box to enter a value to add
- A new track is created each time you hit Go.
- Windows
- There is a box to enter a value to add
- A new track is created each time you hit Go.
- Linux
- There is a box to enter a value to add
- A new track is created each time you hit Go.
- Select Copy, and hit Go.
- Mac
- There is no box for entering a value
- A new track is created
- Windows
- There is no box for entering a value
- A new track is created
- Linux
- There is no box for entering a value
- A new track is created
- Select Divide, enter 2, hit Go
- Select Subtract, enter 4, hit Go
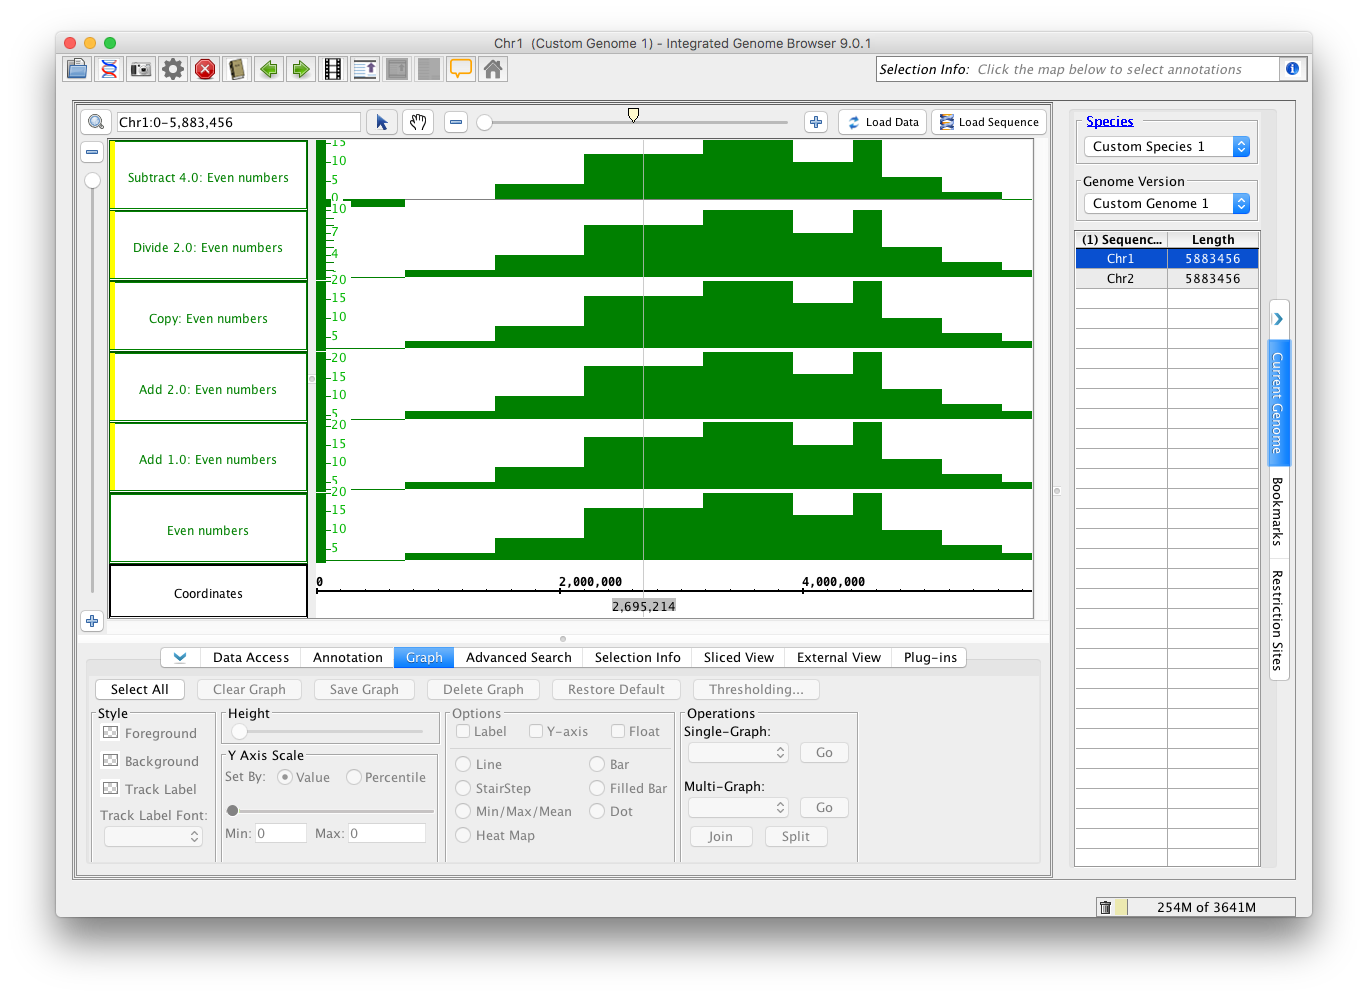
- Use the Select All button (upper left of Graph panel) to select all of these tracks. Select StairStep. Adjust the width of the label box so you can see the full label for each track.
- Compare your window to the image below
- Observe that:
- Mac
- All of the tracks you created have a yellow highlight in the label box
- All of the tracks have appropriate names, which include the function, any values you added, and the name of the original track
- All of the graphs are shaped like the original, (subtract may look a little different because the relative position of zero has changed.
- Windows
- All of the tracks you created have a yellow highlight in the label box
- All of the tracks have appropriate names, which include the function, any values you added, and the name of the original track
- All of the graphs are shaped like the original, (subtract may look a little different because the relative position of zero has changed.
- Linux
- All of the tracks you created have a yellow highlight in the label box
- All of the tracks have appropriate names, which include the function, any values you added, and the name of the original track
- All of the graphs are shaped like the original, (subtract may look a little different because the relative position of zero has changed.
- Click in the original track in the region that has the value 16 (see the zoom stripe in the image above).
- Go to the Selection Information panel.
- In the original track, the y coord value should be 16; make sure you are in the right region.
- Click the same area in each of the tracks that you created and verify that their values are as follows:
- Mac
- Add 1: 17
- Add 2: 18
- Copy: 16
- Divide by 2: 8
- Subtract 4: 12
- Windows
- Add 1: 17
- Add 2: 18
- Copy: 16
- Divide by 2: 8
- Subtract 4: 12
- Linux
- Add 1: 17
- Add 2: 18
- Copy: 16
- Divide by 2: 8
- Subtract 4: 12
Go to the Data Access panel and remove each of the tracks you created.
Single Track Operations - part 2 - powers
Go to the Graph panel, and select the Even Numbers track.
- Select Multiply, enter 2, and hit Go.
- Select Sqrt, hit Go
- Select Power, enter 2, and hit Go.
- Select Power, enter 3, and hit Go.
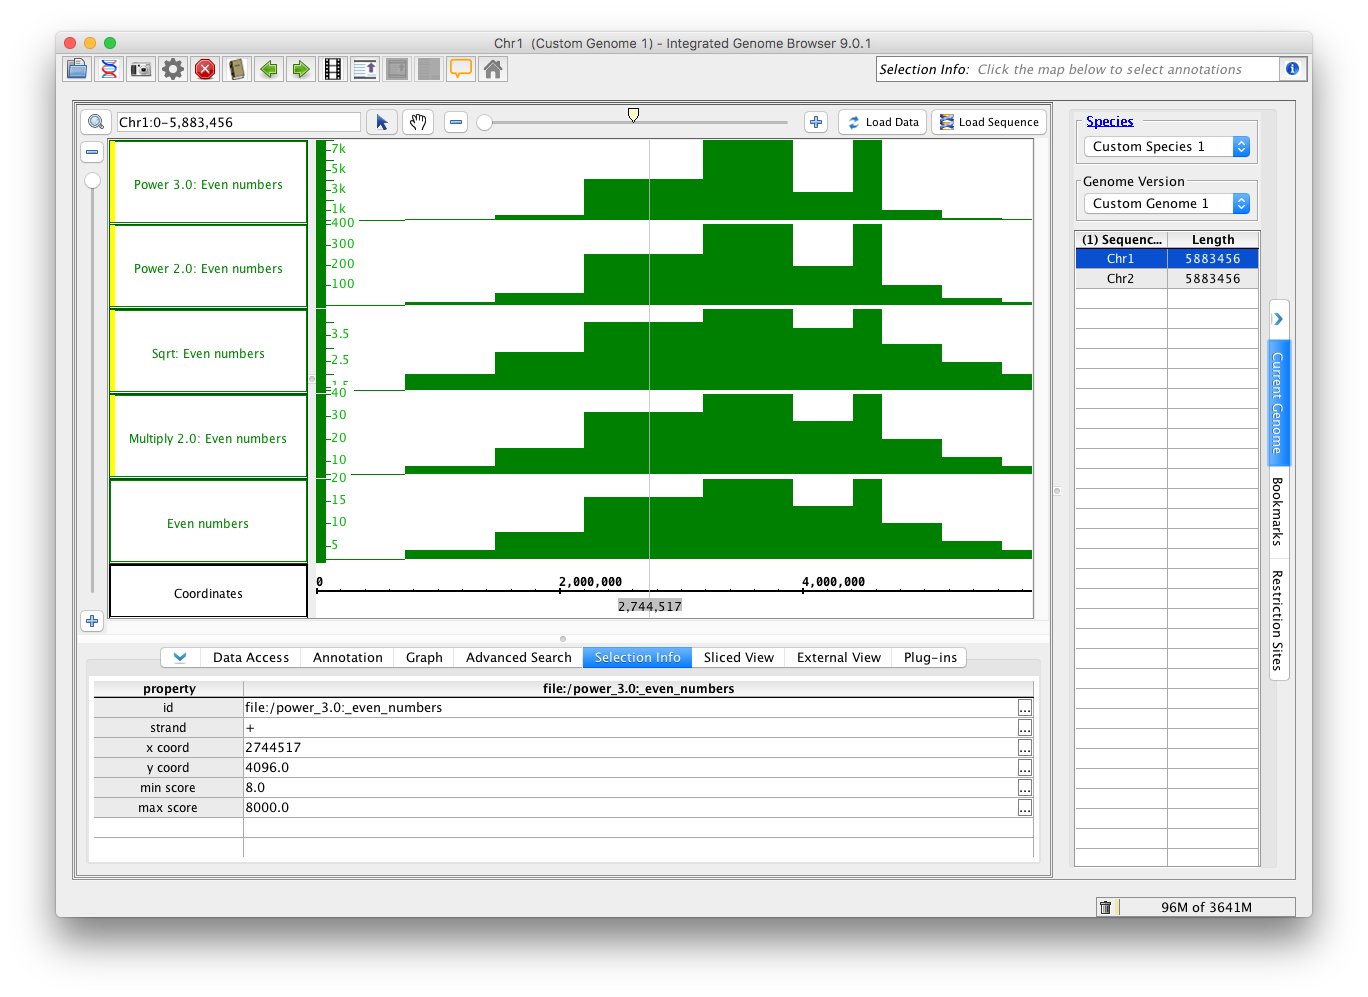
- Use the Select All button (upper left of Graph panel) to select all of these tracks. Select StairStep. Adjust the width of the label box so you can see the full label for each track.
- Compare your window to the image below
- Observe that:
- Mac
- All of the tracks have appropriate names, which include the function, any values you added, and the name of the original track
- All of the graphs are shaped like the they are in the image.
- Windows
- All of the tracks have appropriate names, which include the function, any values you added, and the name of the original track
- All of the graphs are shaped like the they are in the image.
- Linux
- All of the tracks have appropriate names, which include the function, any values you added, and the name of the original track
- All of the graphs are shaped like the they are in the image.
- Go to the Selection Information panel.
- Mac - In the original track, the y coord value should be 16; make sure you are in the right region.
- Windows - In the original track, the y coord value should be 16; make sure you are in the right region.
- Linux - In the original track, the y coord value should be 16; make sure you are in the right region.
- Click the same area in each of the tracks that you created and verify that their values are as follows:
- Mac
- Multiply by 2: 32
- Sqrt: 4
- Power 2: 256
- Power 3: 4,096
- Windows
- Multiply by 2: 32
- Sqrt: 4
- Power 2: 256
- Power 3: 4,096
- Linux
- Multiply by 2: 32
- Sqrt: 4
- Power 2: 256
- Power 3: 4,096
- Mac
Go to the Data Access panel and remove each of the tracks you created. Return to the Graph panel, and select the Even Numbers track.
Single Track Operations - part 3 - log and inverse
Go to the Graph panel, and select the Even Numbers track.
- Select Inverse, hit Go
- Select Natural Log, hit Go
- Select Log, enter 3, hit Go
Select all three of these tracks; hold the shift key and click on each. With all three selected, do the following:
- Change the foreground color to pink
- Select the Inverse single track operation, hit Go
- Mac - observe that this creates 3 new pink tracks.
- Windows - observe that this creates 3 new pink tracks.
- Linux - observe that this creates 3 new pink tracks.
Select the Even Numbers track and the Inverse: Inverse: Even Numbers track.
- Select the Multi-Graph operation Diff, hit Go.
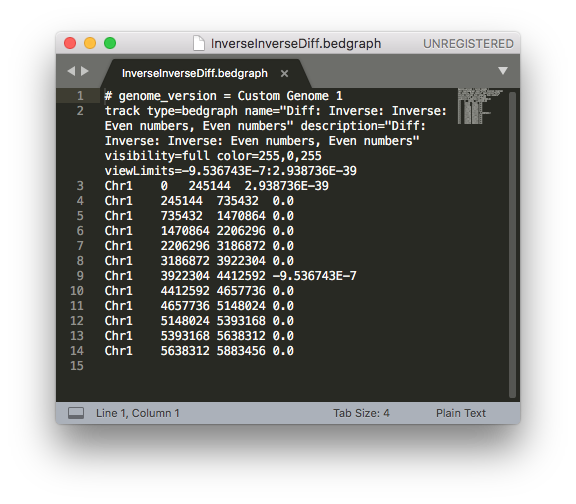
Select all tracks and choose StairStep. Select the track called Diff Even Numbers, Inverse: Inverse: Even Numbers
- Right click the track label
- Choose Save Track As...
- Save the track, suggested name: InverseInverseDiff
- Open this file, and see that all values are 0 (or trivially far from 0).
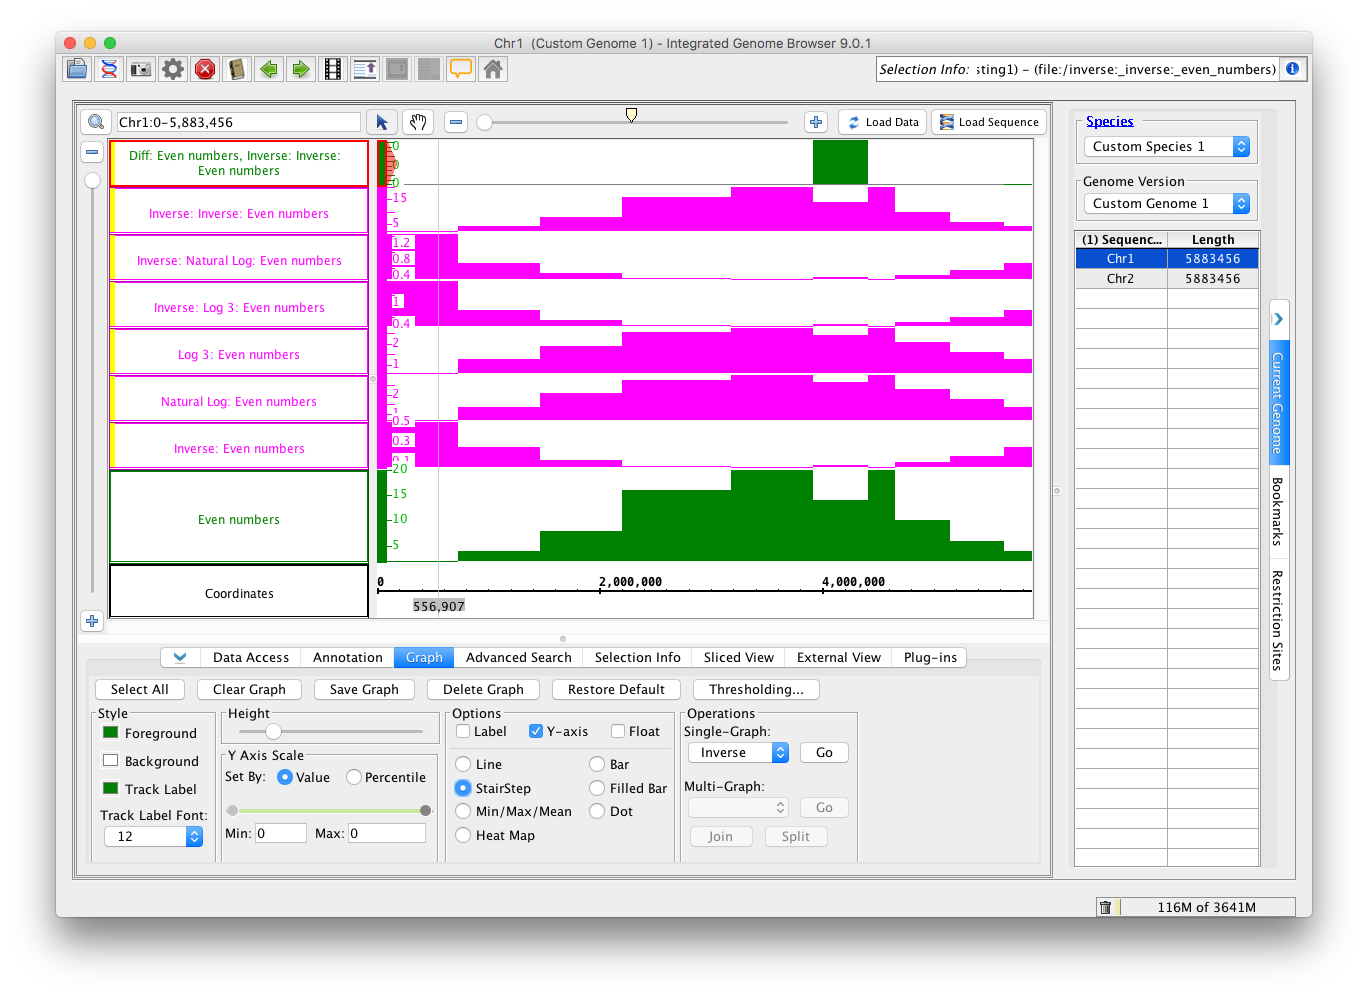
Observe that:
- Mac
- The Diff Inverse Inverse track has all 0-values. Notice that the top and bottom of the y-axis for this track in the image above are 0.
- The shapes and names of tracks corresponds to the image above.
- Windows
- The Diff Inverse Inverse track has all 0-values. Notice that the top and bottom of the y-axis for this track in the image above are 0.
- The shapes and names of tracks corresponds to the image above.
- Linux
- The Diff Inverse Inverse track has all 0-values. Notice that the top and bottom of the y-axis for this track in the image above are 0.
- The shapes and names of tracks corresponds to the image above.
Single Track Operations - part 4 - inverse logs
Go to the Graph panel, and select the Even Numbers track.
- Select Log 2, hit Go
- Select Log 10, hit Go
- Select Log, enter 3, hit Go
- Select Natural Log, hit Go
- Select the Log 2: Even Numbers track, select the Inverse Log 2 operation, hit Go. Delete the Log2: Even Numbers track.
- Select the Log 10: Even Numbers track, select the Inverse Log 10 operation, hit Go. Delete the Log 10: Even Numbers track.
- Select the Log 3: Even Numbers track, select the Inverse Log operation, enter 3, hit Go. Delete the Log 3: Even Numbers track.
- Select the Natural Log: Even Numbers track, select the Inverse Natural Log operation, hit Go. Delete the Natural Log: Even Numbers track.
Set all created tracks to Stairstep. See image.
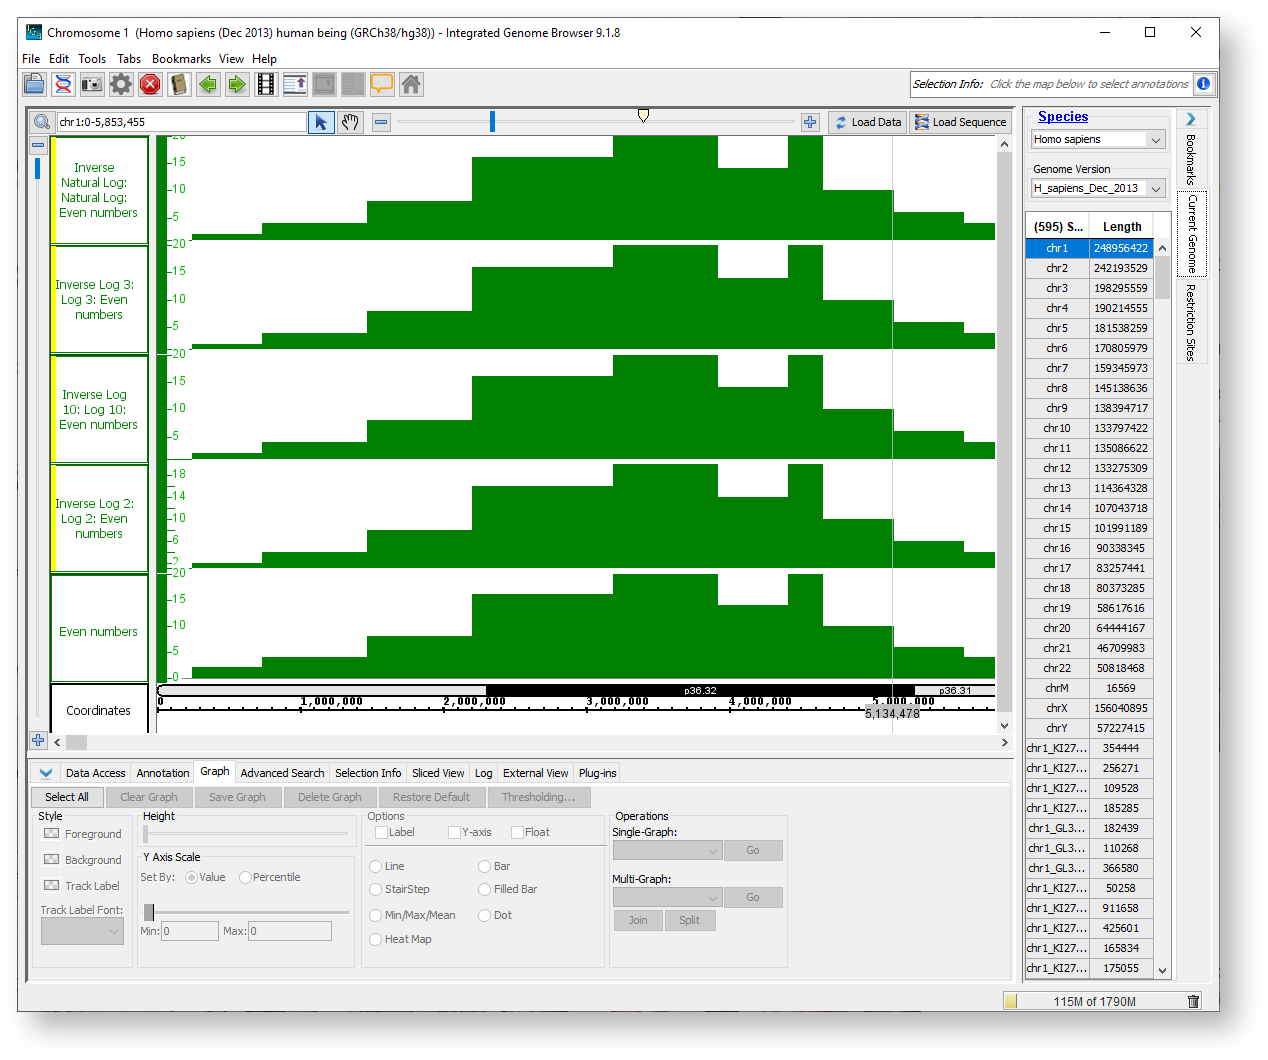
Verify that the created tracks look identical to the even number track (as demonstrated in the picture).
- Mac
- Windows
- Linux
Go to the Data Access panel and remove each of the tracks you created.
Saving a Track
Add the track operations test file. You can do this without selecting any genome, just drag/drop the file onto the home screen. Change the Load Mode to Genome.
Make the Odd Numbers track:
- Select the Even Numbers track. In the Graph panel, under Operations, under Single-Graph, select Add, and enter 1.
- Select All graph tracks, and set them to StairStep.
- Go to the Data Access panel.
- Mac
- Change the Track Name to "Odd Numbers". Change the color (FG) to light blue.
- The new track should be called "Add 1.0: Even Numbers".
- Windows
- Mac
- The new track should be called "Add 1.0: Even Numbers".
- Change the Track Name to "Odd Numbers". Change the color (FG) to light blue.
- Linux
- The new track should be called "Add 1.0: Even Numbers".
- Change the Track Name to "Odd Numbers". Change the color (FG) to light blue.
- Right click on the Odd Numbers track label area and click Save Track As... . Save the file as TrackOperationsTest2, keep the bedgraph file type.
- Add this file (the one you just created) to IGB. Click load data, and set it to StairStep.
- Mac - verify that the track read from the saved file and completely identical to the track it was made from (same color, name, values).
- Windows - verify that the track read from the saved file and completely identical to the track it was made from (same color, name, values).
- Linux - verify that the track read from the saved file and completely identical to the track it was made from (same color, name, values).
Remove the track with the yellow highlight. The two TrackOperationsTest files are what you will use to test the Multi-Track Operations.
Multi-Track Operations
You should have two tracks, one with all even numbers and one with all odd. If not, see section Saving a Track.
Select the Odd Numbers track, hold shift and select the Even numbers track (be sure to select the blue odd numbers first).
In the Graph panel, under Operations, under Multi-Graph, select the first option, and hit go; select the second and hit go. Do this for each operation, and then verify the following points. The values for each operation are given for the range that is 16 in the original Even Numbers file.
- Mac
- Even Numbers: 16
- Odd Numbers: 17
- Sum: Odd Numbers, Even numbers: 33
- Diff: Odd Numbers, Even numbers: 1
- Product: Odd Numbers, Even numbers: 272
- Ratio: Odd Numbers, Even numbers: 1.0625
- Mean: Odd Numbers, Even numbers: 16.5
- Median: Odd Numbers, Even numbers: 16.5
- Max: Odd Numbers, Even numbers: 17
- Min: Odd Numbers, Even numbers: 16
- All track names include both input track names in the order they were select.
- Mac
- Windows
- Linux
For some operations, the order matters.
Even Numbers: 16- Odd Numbers: 17
- Sum: Odd Numbers, Even numbers: 33
- Diff: Odd Numbers, Even numbers: 1
- Product: Odd Numbers, Even numbers: 272
- Ratio: Odd Numbers, Even numbers: 1.0625
- Mean: Odd Numbers, Even numbers: 16.5
- Median: Odd Numbers, Even numbers: 16.5
- Max: Odd Numbers, Even numbers: 17
- Min: Odd Numbers, Even numbers: 16
So now select the Even Numbers track first, hold shift, and select the Odd Numbers track. Produce the tracks to verify the following:
- Even Numbers: 16
- Odd Numbers: 17
- Diff: Even Numbers, Odd Numbers: -1
- Ratio: Even Numbers, Odd Numbers: 0.94117647
- All track names include both input track names in the order they were select.
- Linux
- Even Numbers:
- Mac
- 16
- Odd Numbers: 17
- Sum: Odd Numbers, Even numbers: 33
- Diff: Odd Numbers, Even numbers: 1
- Product: Odd Numbers, Even numbers: 272
- Ratio: Odd Numbers, Even numbers: 1.0625
- Mean: Odd Numbers, Even numbers: 16.5
- Median: Odd Numbers, Even numbers: 16.5
- Max: Odd Numbers, Even numbers: 17
- Min: Odd Numbers, Even numbers: 16
- All track names include both input track names in the order they were select.
For some operations, the order matters. So now select the Even Numbers track first, hold shift, and select the Odd Numbers track. Produce the tracks to verify the following:
- Mac
- Even Numbers: 16
- Odd Numbers: 17
- Diff: Even Numbers, Odd Numbers: -1
- Ratio: Even Numbers, Odd Numbers: 0.94117647
- All track names include both input track names in the order they were select.
- Windows
- Even Numbers: 16
- Odd Numbers: 17
- Diff: Even Numbers, Odd Numbers: -1
- Ratio: Even Numbers, Odd Numbers: 0.94117647
- All track names include both input track names in the order they were select.
- Linux
- Even Numbers: 16
- Odd Numbers: 17
- Diff: Even Numbers, Odd Numbers: -1
- Ratio: Even Numbers, Odd Numbers: 0.94117647
Joining and Splitting graphs
For this test, we will use files from the QuickLoad site.
- Select the Arabidopsis thaliana genome (June 2009)
- In the Data Access panel, find IGB Quickload / Chip-Seq / ARR10 PRJNA263839 / graphs
- Select:
- the first one (line a1 BA-treated ChIP rep1 coverage)
- the second one (line a1 BA-treated non-IP rep1 coverage)
- the seventh one (line a2 non-BA-treated ChIP coverage)
- Navigate to Chr1:8,036,457-8,056,240
- Click Load Data
- Arrange them so the green one is on top, then the pink, then the red.
- Select them in this order: pink, red, green.
- In the graph panel, select Join.
- Verify that:
- Mac
- The three tracks now share a single label field called "Joined Graphs".
- The three tracks are ordered top to bottom: pink, red, green (the order of the selection)
- Windows
- The three tracks now share a single label field called "Joined Graphs".
- The three tracks are ordered top to bottom: pink, red, green (the order of the selection)
- Linux
- The three tracks now share a single label field called "Joined Graphs".
- The three tracks are ordered top to bottom: pink, red, green (the order of the selection)
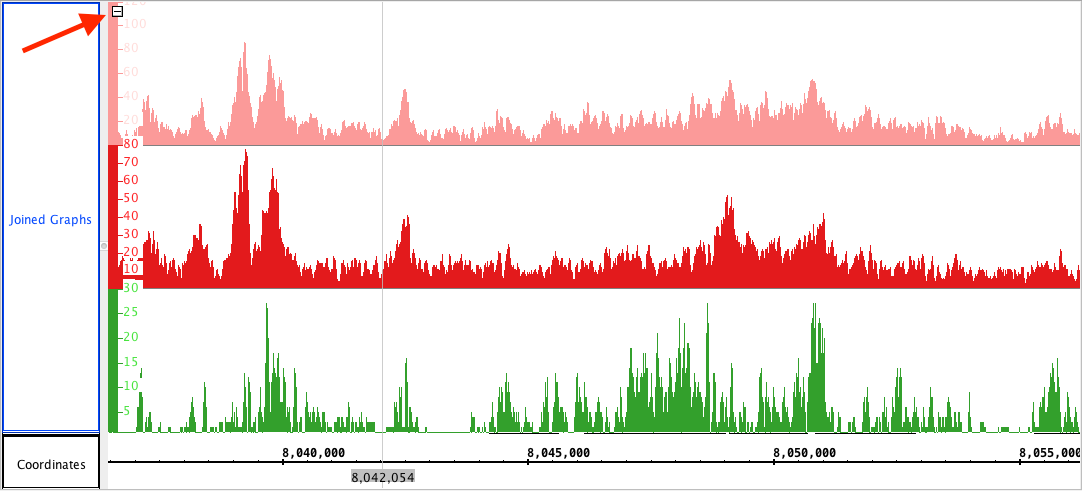
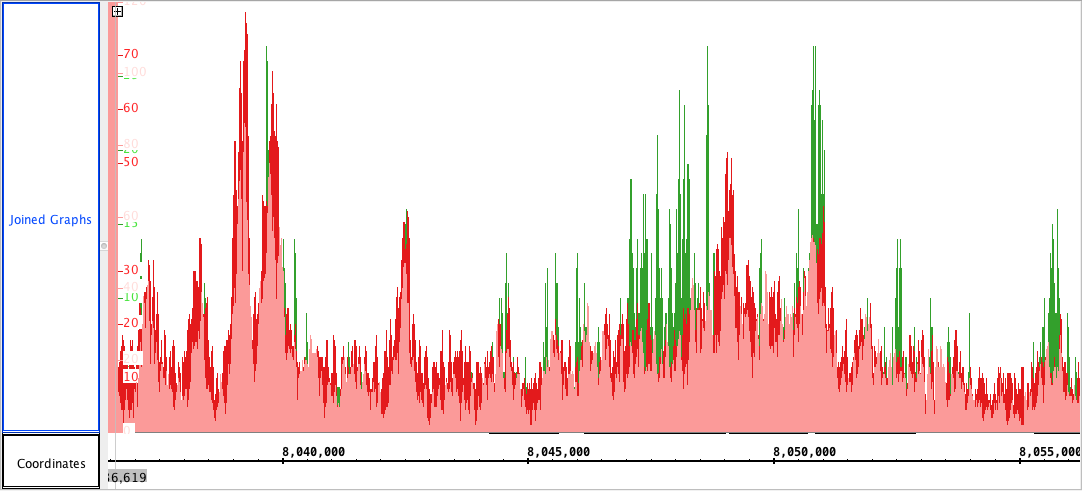
- Click the little minus button [-] in the upper left corner of the joined tracks.
- Verify that:
- Mac
- pink the most visible (its in front), red is the next most visible and green is in the back. (see images)
- Click the + button to expand them. The top-to-bottom order unchanged.
- Windows
- pink the most visible (its in front), red is the next most visible and green is in the back. (see images)
- Click the + button to expand them. The top-to-bottom order unchanged.
- Linux
- Windows
- Linux
Joining and Splitting graphs
For this test, we will use files from the QuickLoad site.
- Select the Arabidopsis thaliana genome (June 2009)
- In the Data Access panel, find IGB Quickload / Chip-Seq / ARR10 PRJNA263839 / graphs
- Select:
- the first one (line a1 BA-treated ChIP rep1 coverage)
- the second one (line a1 BA-treated non-IP rep1 coverage)
- the seventh one (line a2 non-BA-treated ChIP coverage)
- Navigate to Chr1:8,036,457-8,056,240
- Click Load Data
- Arrange them so the green one is on top, then the pink, then the red.
- Select them in this order: pink, red, green.
- In the graph panel, select Join.
- Verify that:
- The three tracks now share a single label field called "Joined Graphs".
- The three tracks are ordered top to bottom: pink, red, green (the order of the selection)
- Mac
- Windows
- Linux
- Click the little minus button [-] in the upper left corner of the joined tracks.
- Verify that:
- pink the most visible (its in front), red is the next most visible and green is in the back. (see images)
- Click the + button to expand them. The top-to-bottom order unchanged.
- Mac
- Windows
- Linux
- Click the shared label area. In the graph panel, select Split.
- Mac - Verify that all tracks are separate again.
- Windows - Verify that all tracks are separate again.
- Linux - Verify that all tracks are separate again.
- Repeat the above steps using a different selection order
- Mac - verify the the order is reflected in how the tracks are stacked together.
- Windows - verify the the order is reflected in how the tracks are stacked together.
- Linux - verify the the order is reflected in how the tracks are stacked together.
To mimick the images exactly (optional):
- Go to this region: Chr1:8,036,457-8,056,240
- In the Graph panel, select all graphs, click the Height knob (no need to actually slide it).
- Select the red track and set the Max to 80.
- Select the green track only and set the Max to 30.
- Select the pink track and set the Max to 120.
Users Guide
-
Reviewed the users guide pages. Each page has accurate information and generally appears up-to-date.