| Table of Contents |
|---|
Introduction
As you learn to use IGB, you'll find it offers many features that make it one of the best tools available for visualization and exploration of genomic data sets.
If you are new to IGB, the following six step use this Quick Start Guide will help you get started using IGB.
| Table of Contents |
|---|
Step 1: Get and start IGB
...
- Go to biovizBioViz.org/igb/download.html IGB Download Page
- Download and launch IGB.
...
- and click the Download button
- Select and download the installer for your platform
If you have trouble starting IGB, see visit the Troubleshooting page or feel free to contact us. help page on BioViz.org for assistance.
Step 2: Choose species and genome version
There are many To choose a species and genome versions in IGB.version
- Click a start screen shortcut image to automatically load the most current reference annotations(loads most recent genome)
or
- Choose Species and Genome Version using the Current Genome tab.
IGB showing the H. sapiens RefGene models
...
start screen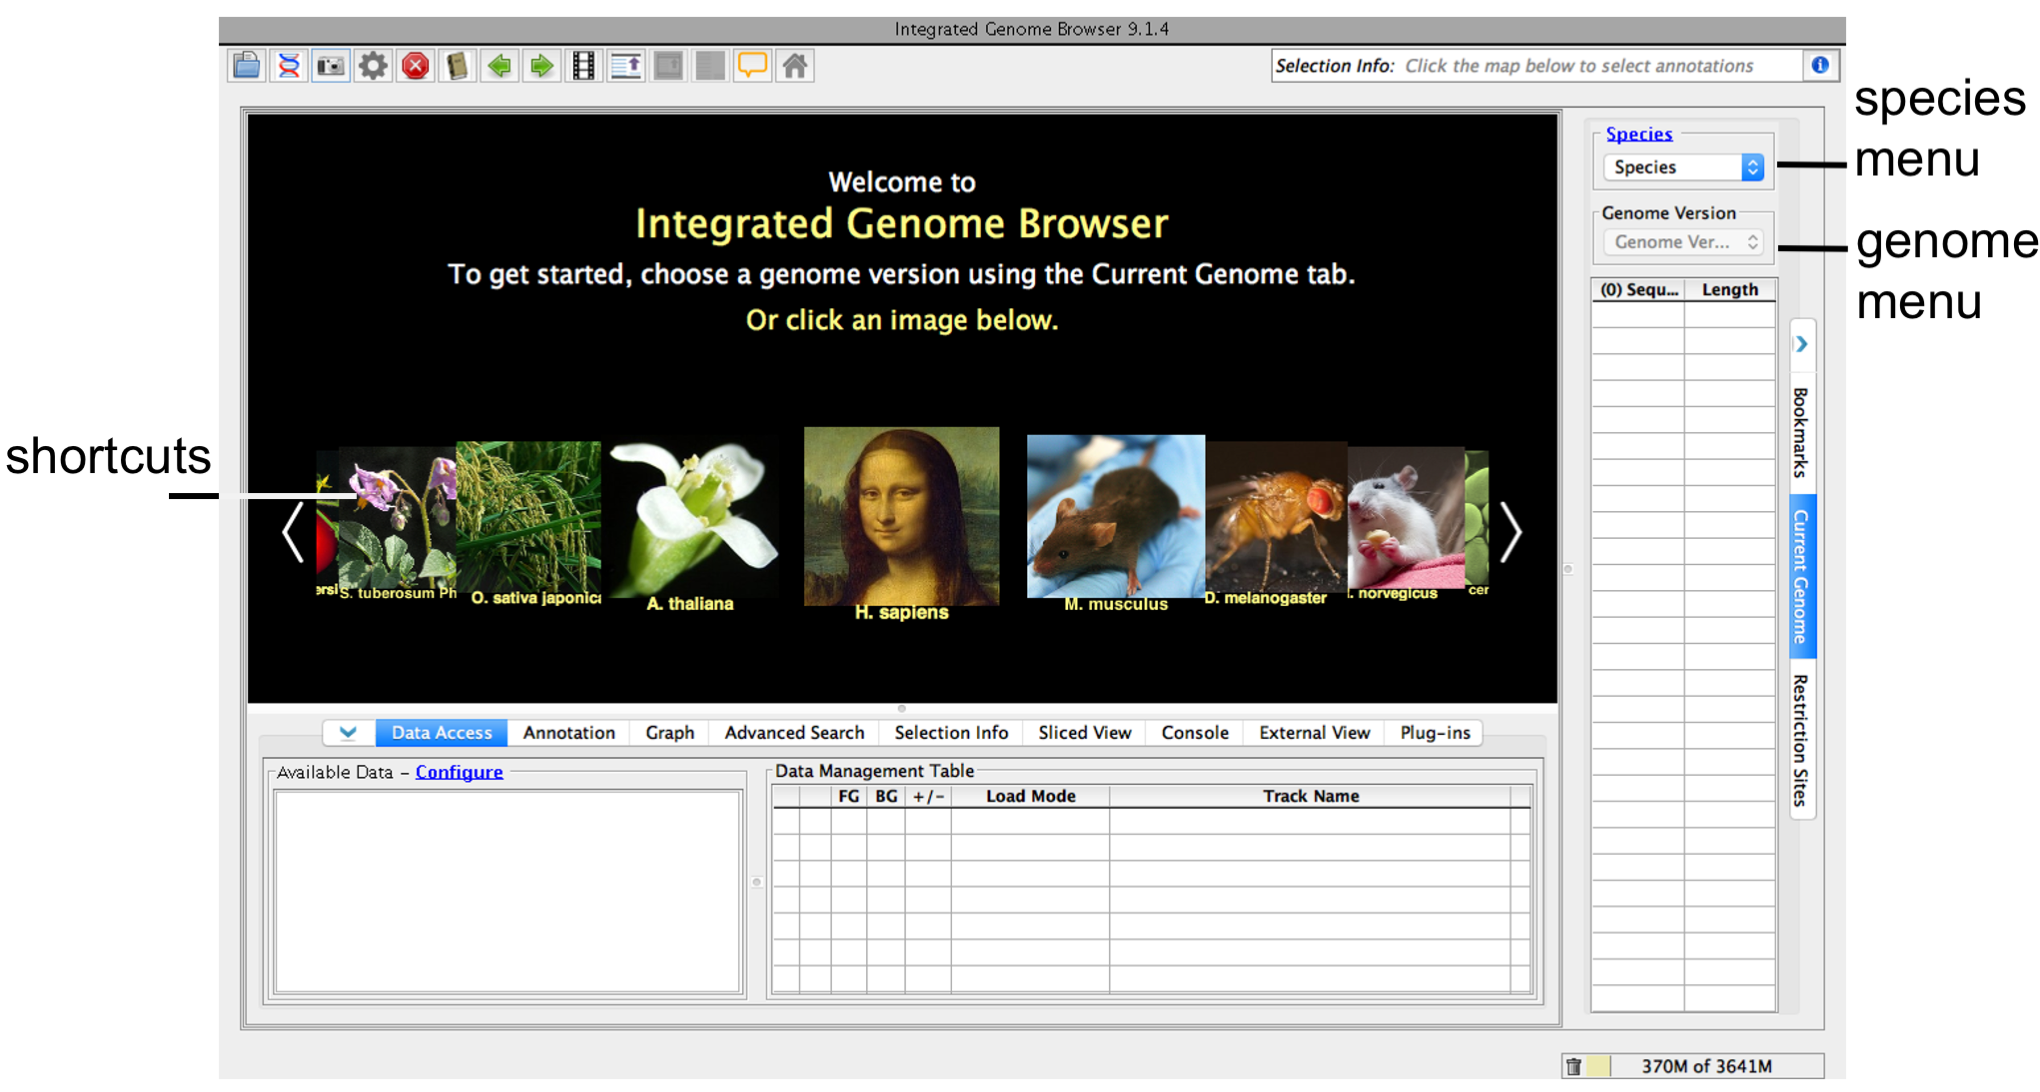
If your species or genome version is not listed, you can
...
See also
view it if you have a fasta or 2bit file with sequence data. See Custom Genomes
Step 3.
...
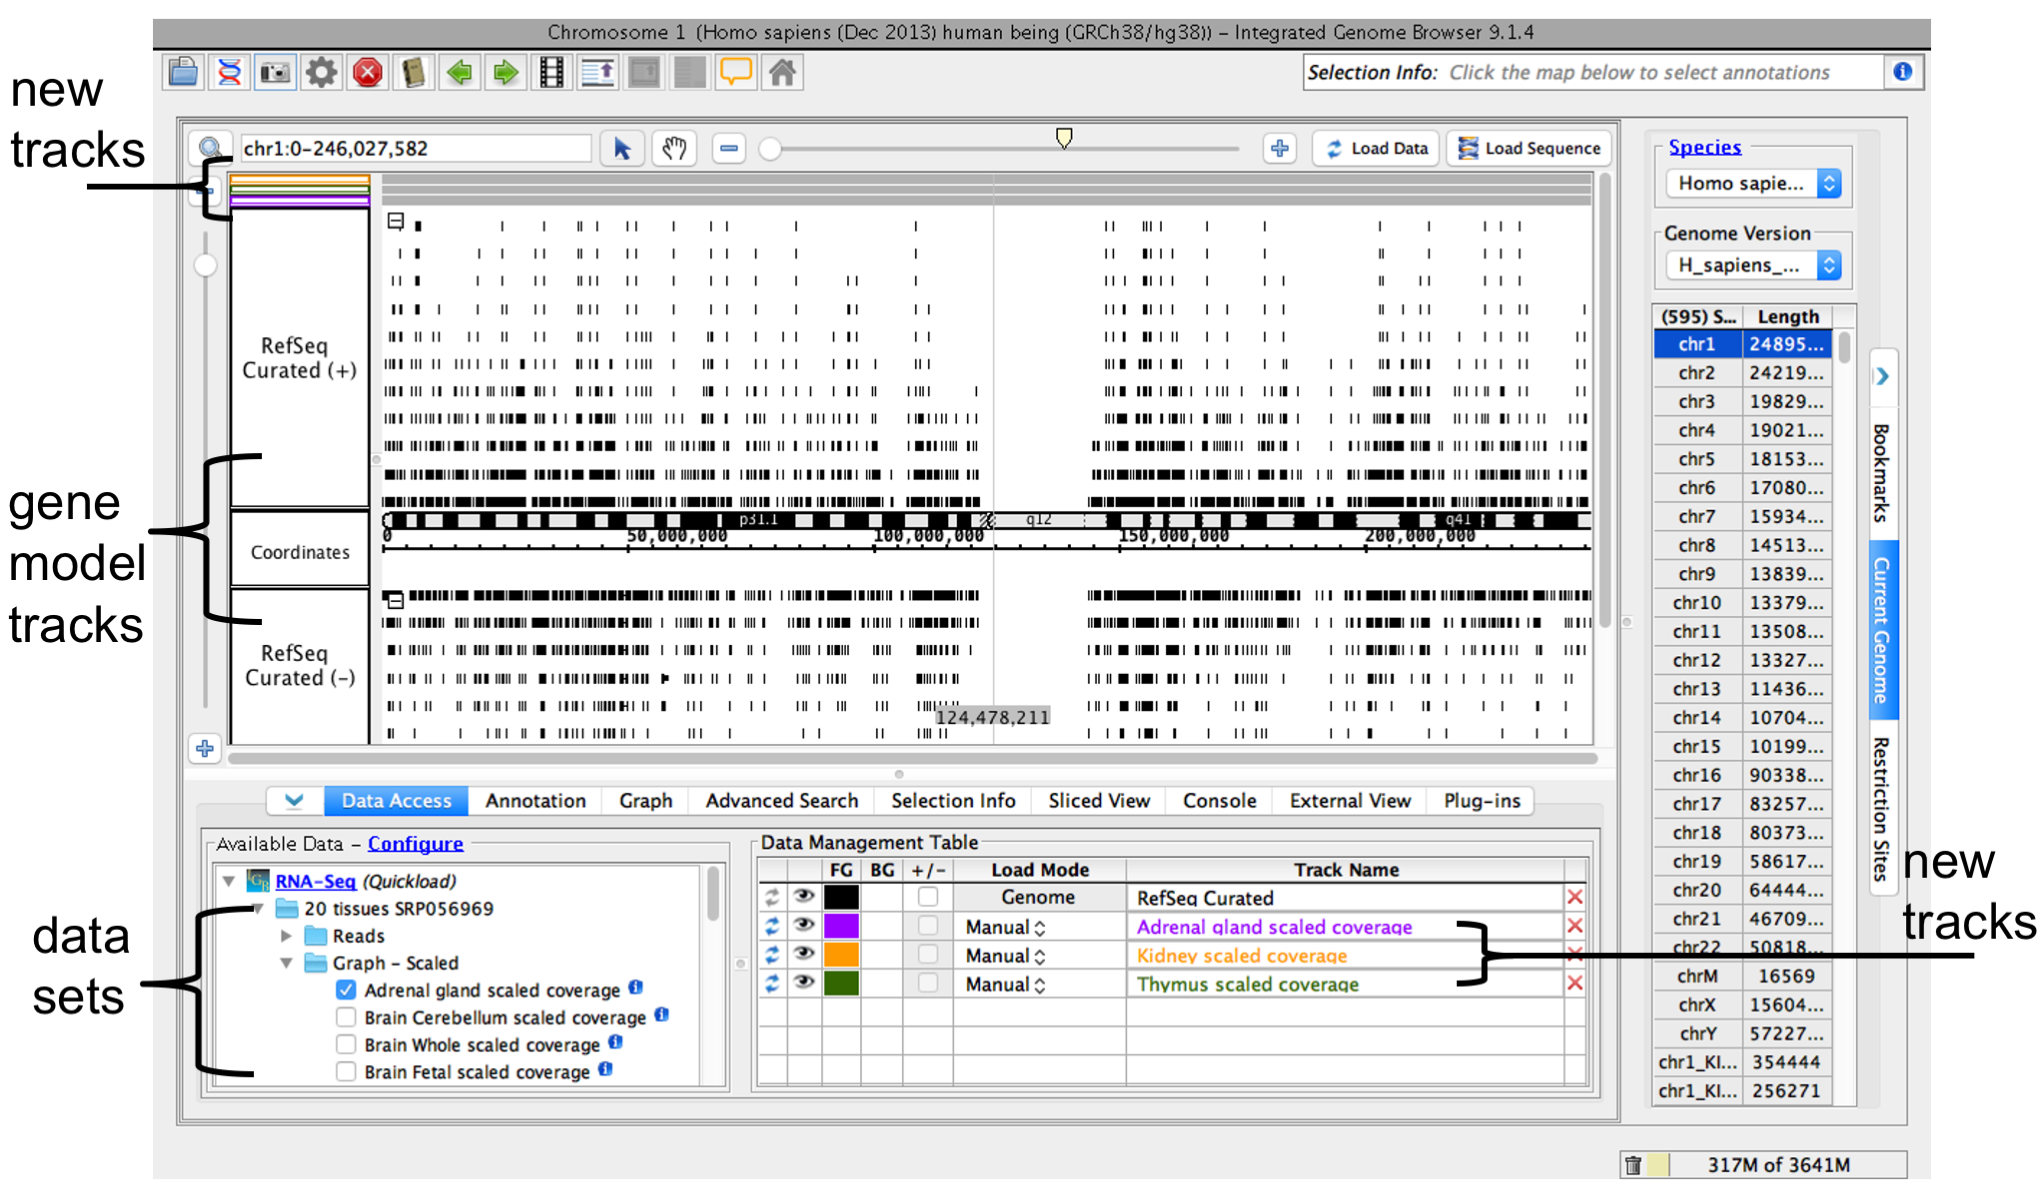
Open data sets
Available Data folders
Open a folder under the Available Data file tree (red box) and select data sets:
- Check the box (red arrow)
- Drag the data set into the Data Management table
Local files
To view data from local or remote files
...
Open data sets from remote data sources (Data Access tab) or by opening local files.
To open a data set from an IGB Quickload data source (see About IGB Quickload)
- Select Data Access
- Select data sets in the Available Data section
To open local files on your computer
- Select File > Open File... or File > Open URL...
...
- Enter file name or
...
- URL
...
When you select a data sets or
...
a file, IGB adds a new empty track to the main view and lists it in the Data Management table.
...
Empty regions in the new track that do not have data loaded are gray.
IGB window after opening human genome RNA-Seq coverage graphs from Adrenal Gland, Kidney, and Thymus data sets
Step 4: Zoom in
Because many data files contain too much data to
...
view all at once,
...
Reference sequence
If you have a sequence in the fasta, 2bit, or bnib format,and you would like to use it as the reference sequence
- Use File > Open Reference Sequence...
- Press Load Data button (see Step 5).
- Sequence will appear in the Coordinate Axis
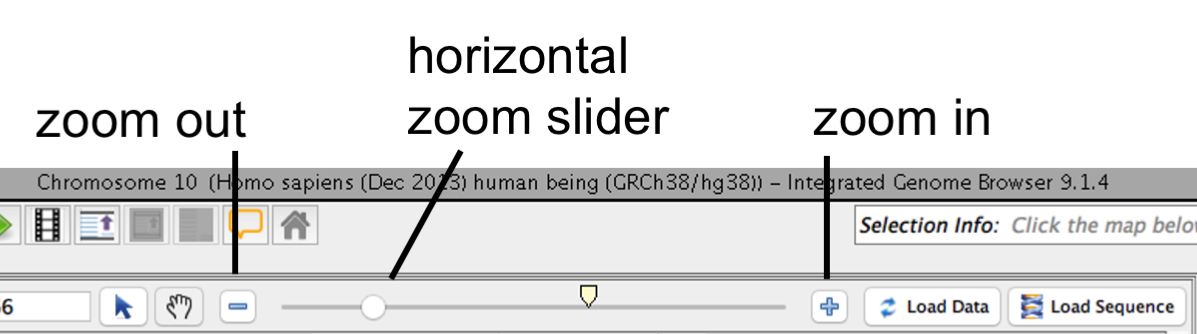
Step 4: Zoom in
- Use the zoom slider: Click in main view to set the center of the focused zooming (Zoom Stripe). Use the zoom slider to zoom in or out.
- Search for a gene or region: Enter range values in the range box and hit enter to jump to a specific region. Enter a keyword or gene name into the range box OR use the Advanced Search tab to search for a specific gene model or feature; double-click a search result to jump to that feature.
...
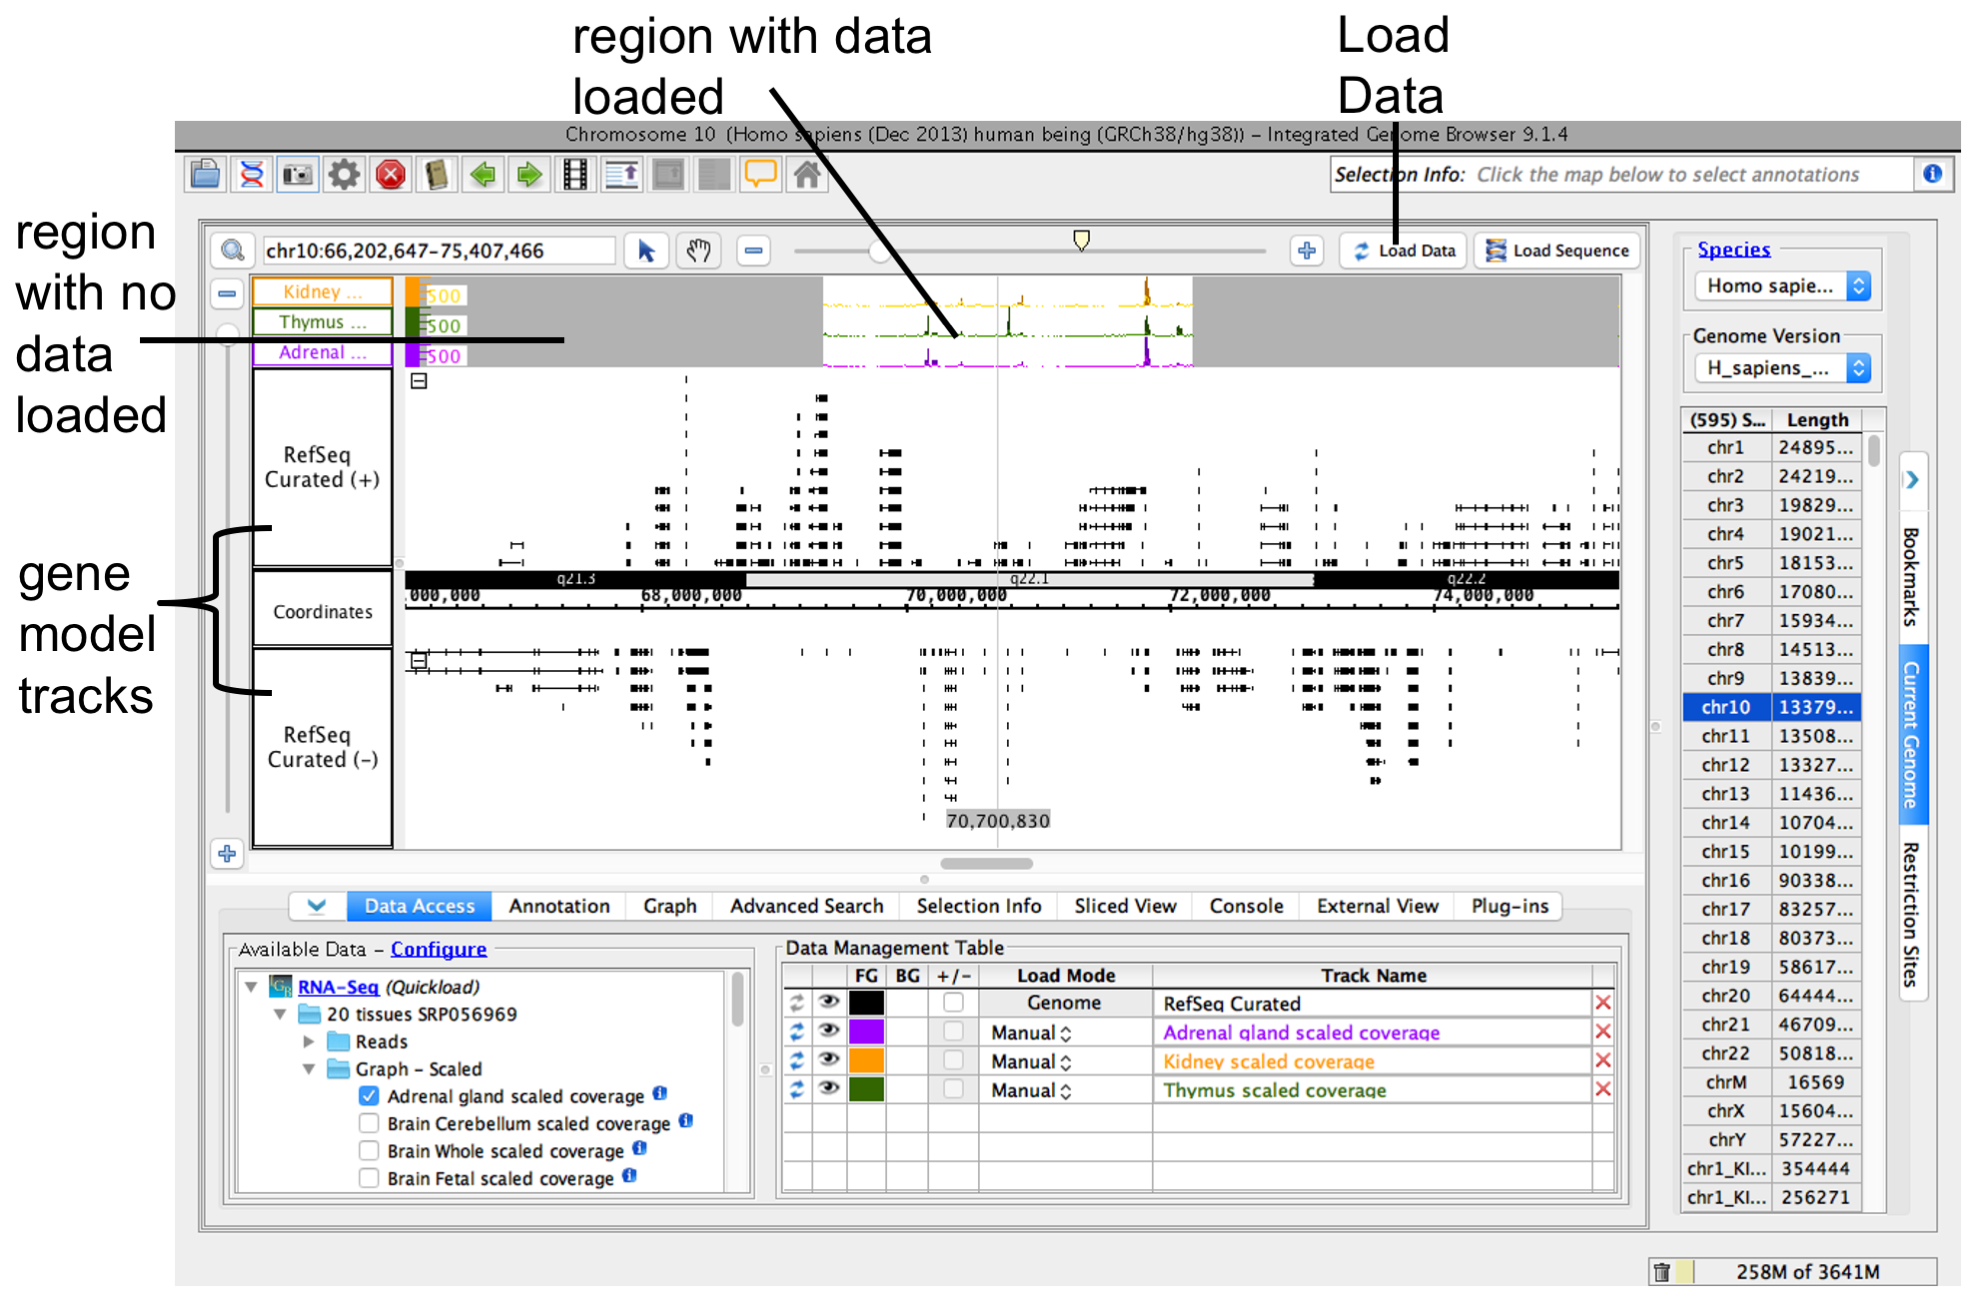
IGB does not load data into the viewer until you click the Load Data button.
Before loading data, zoom in to a region.
- Click a location in the main view
- Drag the horizontal zoom slider or use plus and minus buttons
IGB horizontal zooming controls
Other ways to zoom
Other ways to zoom include
- Search for a gene by name or keyword (For example, TBATA or thymus)
- Double-click an exon or gene model to zoom in on it
- Click-drag the coordinate axis to zoom in on a region
See also:
Step 5:
...
Load data
To load data, click Load Data button
...
This will load and draw the data and sequences that you have selected in the Main View.. Regions with loaded data show the selected background color; areas without loaded data appear darker.
IGB after loading data
See also:
Step 6: Configure tracks
You can reorder the tracks by dragging the Track Label into the position you want (the Data Management Table reflect changes).
The Annotations tab will allow you To change style elements of a track, click the track label and use the Annotation or Graph tab to change to change color, sizetrack height, annotation label, amount of data shown as well as other various functions(stack height), and other options.
See also: