| Anchor |
|---|
| Table of Contents | genandchr |
...
Genomes and
...
All data viewed in IGB, regardless of its source, is organized into distinct 'genomes' and 'chromosomes'.
...
chromosomes
Chromosomes, also called contigs or reference sequences, refer to one or more annotated sequences that form a genome assembly. For completed genome projects, these correspond to the sequence of a physical chromosome. At other times it For less complete genomes, they may represent an assembled contig, a BAC, or any other DNA sequence. All chromosomes in IGB are assumed to be DNA, rather than RNA sequences. No two chromosomes within the same genome version can have the same name.A genome version, or genome, refers assembled contigs that correspond to parts of a physical chromosome.
Genome, genome version, or assembly refer to a group of chromosome sequences that you or another group assembled and made available. These are usually designated by annotated sequences corresponding to the genome sequence of an organism. IGB designates these using the month and year they were published or made publicly available. For example, NCBI versions 35 and 36 of the human genome are considered to be two separate genomes. Each one contains multiple chromosome sequences, including the expected chromosomes 1 to 22, X and Y. Other sequences, such as "chr22_random" are also considered distinct chromosomes for the purposes of display in IGB.
Every sequence in IGB is identified by its genome and chromosome names, which must therefore be distinct.
Tracks: Annotations, Graphs, Sequences, Reads and Alignments
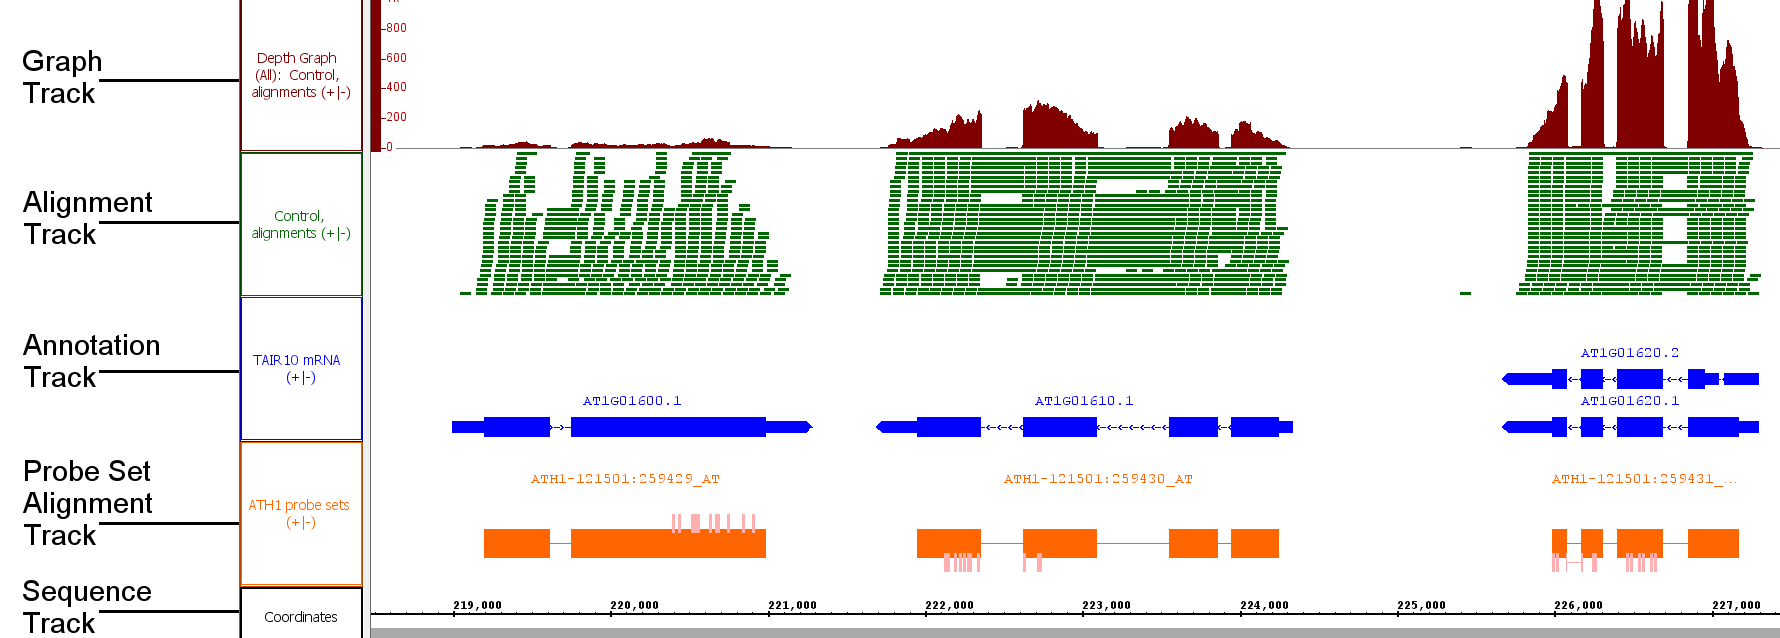
Tracks: IGB can work with four distinct types of data: annotations, graphs, genomic sequences, reads and alignments (typically from Illumina sequencing experiments). Some features of the program are type-specific and will only work with specific types of data. These data types appear in IGB in separate lanes called tracks (occasionally called tiers).
...
Tracks
Tracks are rows of data read from the same file or data set. When you open a file, the data within the file will appear in one or more tracks. Older versions of IGB referred to tracks as "tiers" and so you may see this term used elsewhere in the User's guide. There are three main types of tracks: Graph tracks, Annotation tracks, and Reference Sequence tracks. Alignment tracks and Probe Set tracks are types of Annotation Track.
...
Annotation tracks
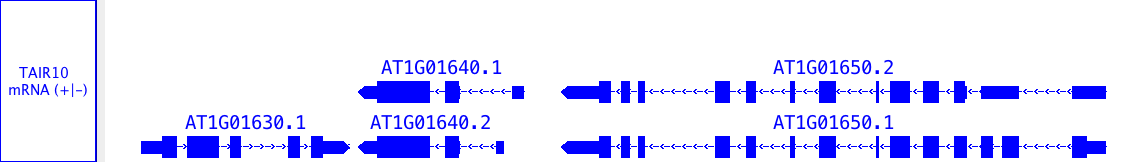
Annotations indicate the known or suspected locations of genomic landmark features such as genes, exons, promoter regions, pseudogenes, and so forth; these are referred to as features, elements or gene models. Sometimes the word 'annotation' refers to a specific feature within an annotation track as well. Other less obvious data, including alignments of EST sequences, GeneChip probe sequences, and other sequences onto chromosome, are also sometimes referred to as annotations, particularly when they don't include the sequence of the aligned entity. Annotation data can be loaded from files, QuickLoad and DAS servers. Read Working with Annotation Tracks
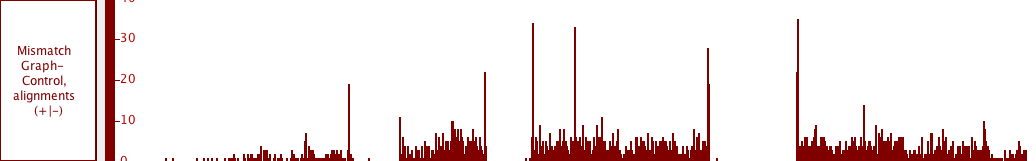
Graphs are tracks showing scores or other numeric values as a function of genomic position. Graphs are generally displayed as some form of plot (line plot, bar plot, heat map, etc.). The results from tiling arrays are generally represented as graphs. There are two types of graph data: point-based graphs, in which numerical values are associated with individual (single) base positions; and interval graphs, which capture values associated with ranges of genomic positions. IGB can generate certain types of graphs from annotation tracks, based on the data within the annotation track. Read Working with Graph Tracks
Sequences are sets of DNA residues comprising a chromosome. . Annotations may consist of a single coordinate, a single span with a start and end positions, or a collection of spans. Most annotations reside on either the plus or minus strand of a chromosome, but some do not.
Examples of annotations include:
- single-coordinate feature: splice site
- single-span feature, with strand: an exon
- single-span feature, no strand: sequence recognized by a restriction enzyme
- multi-span feature, with strand: a gene model
...
Graphs tracks
Graphs are numeric data associated with regions or single-base positions in a chromosome.
...
Sequence track
Sequences are DNA residues from a chromosomes or contigs that together make an assembly. Sequences can be fully or partially loaded from local files, QuickLoad Quickload sites, or DAS servers. It is recommended to load sequence data only for small regions of the genome at a time. IGB allows you to examine sequence data in a separate window called the Sequence Viewer. Read Working with Sequence DataAlignments or Reads Distributed Annotation Servers. You can view sequence data in the Coordinates track or by opening the Sequence Viewer.

...
Alignments
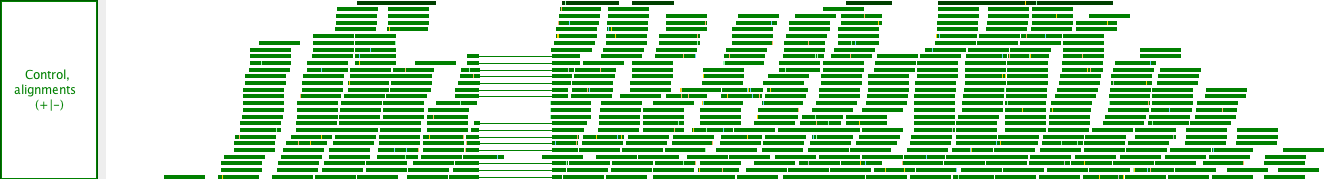
Alignments represent how sequences obtained from an experiment (such as sequence reads from an RNA-Seq experiment) align onto the a reference genomic sequence. At At low zoom they look like annotations, but with marks representing mismatches between the read and the reference genome whenever these data are available. At higher zoom they show the sequence of the aligned read, and sometimes indicate scores and the degree of agreement with the reference sequence. These are typically loaded from BAM (binary alignment) files. Read Viewing short read alignments, insertions, or deletions. At higher zoom, the aligned sequence bases become visible.
...
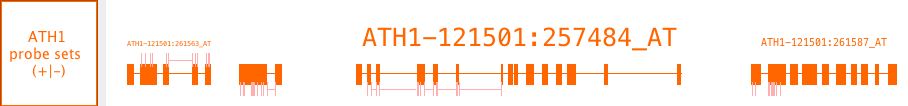
Probe set alignments
Probe set alignments consist of Affymetrix probe set target sequences aligned onto the reference with probe locations indicated as annotations on the target sequence alignments. The probes are kind of annotation on an annotation.
These data are Affymetrix specific.