| Table of Contents |
|---|
Introduction
The Sliced View tab displays an alternative view of items selected from in the Main View. It displays the same data as in the Main View but deletes some of the intronic "space" within gene models.
It is mainly useful in depicting mammalian genes which often span many kilobases and mostly consist of intronic sequence.
The following image shows how this works. The top panel of the IGB Main View window shows the normal, non-spliced view of a region containing overlapping genes from a human, AGBL4 which contains several very large introns, one of which completely encompasses another gene, BEND5. The Sliced View panel on the bottom shows AGBL4, and then BEND5, but with the gaps between exons reduced to 100bp.
Black hash marks in the Sliced View coordinate axis indicate points where sequence was deleted from between the exons. Note how the Sliced View makes understanding and visualizing the exons easier than in the Main View, where exons are dwarfed by the much larger intronic regions.
Sliced view example (click to enlarge)

Sliced view example (click to enlarge)

The Sliced View Panel
The Sliced View panel provides you with the opportunity to concentrate on specific elements of gene models. Slicing redraws long and variable length introns into consistent, defined (and short) lengths, allowing you to focus on the exons of a selected annotation or set of annotations. By showing the exons relative to each other without intronic variability, you can find pattern irregularities, exonic discrepencies and possible alternate splicing more obvious.
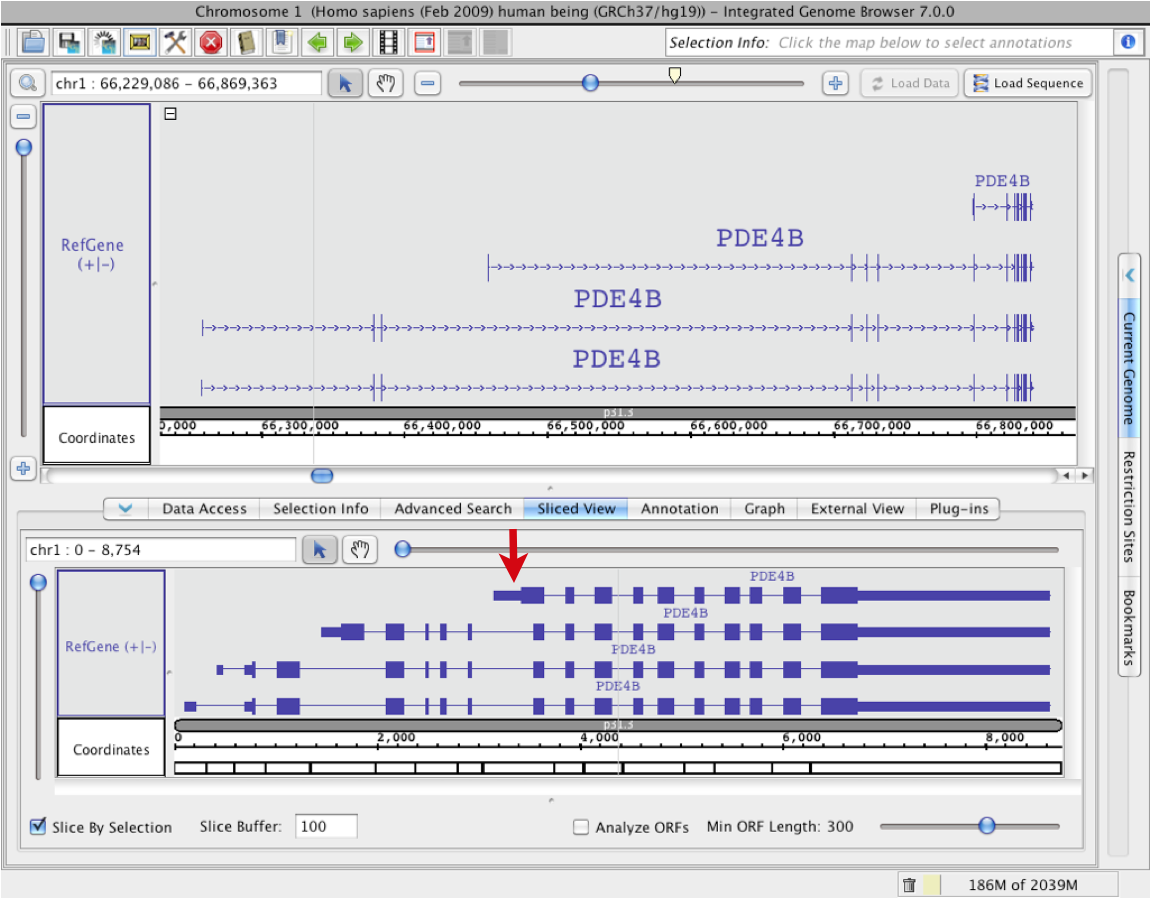
Open the Sliced View panel, and be sure that the Slice Buffer is set to a number you like. The Slice Buffer is the size that IGB will use to draw in the introns. The default is 100bp, which is typically a very good size for most genes (see red box in image below); you may also set the slice buffer to 0 to completely eliminate the introns. In the main view, select one or all annotations to include in the slice by clicking or outlining with the Select tool (Selecting Items). In the following example we have selected all 4 gene models for human gene PDE4B.

IGB may take a few moments to display the sliced region. For easy comparison, the sliced view displays sliced versions of all annotation tracks and graphs in the region being viewed. Use the zoom and scroll bars to navigate in the sliced view panel. Note that the numbers in the Coordinates track in the sliced view panel indicate scale; they don't correspond to genomic coordinates. Endpoint matching in the upper and lower windows are independent of each other.In the Sliced View, introns are shown as having the same size, set in the Slice Buffer box). The Sliced View also can show open reading frames (ORFs).
Sliced view example (click to enlarge)
Display sliced view of a gene
To view a sliced view of a gene
- Click the Sliced View tab to make it the active bottom tab
- Open the Sliced View tab in a separate window (this is optional) Tabs > Open Current Bottom Tab in New Window
- Click a gene model in the Main View
- Observe that the same gene model appears in the Sliced View but intronic regions are removed
Sliced View options
The bottom row of the Sliced View panel shows options for controlling Sliced View appearance.
Sliced View options (click to enlarge)

Slice by Selection
This option controls when the Sliced View updates. Check this option to ensure that whatever is selected in the Main View is shown in the Sliced View display.
Slice Buffer
The Slice Buffer setting controls the size of introns drawn in the Sliced View display. The "buffer" consists of intronic sequence on the five and three prime ends of exons.
Analyze ORFs
Check this option to activate display of ORFs (open reading frames) underneath the Sliced View coordinate axis track.
Min ORF Length
This option controls the size of ORFs shown when Analyze ORFs is checked.
Viewing deletions and insertions
The Sliced View can help you see where sequences present in one transcript are absent from the others due to alterantive alternative splicing.
To examine alternate splicing using the Sliced View
- select one of the or more transcripts in the Main View
- observe insertion icons deletion icons (X characters) IGB draws on the other transcripts
The following images illustrates this.
In the first image, the arrows show how IGB draws regions where an annotation is 'inserted'; the introns in 'non-inserted' tracks are elongated over the region of insertion.

...
- insertions are shown as larger introns
Insertion example
In this example, all four gene models were selected in the main view when the sliced view was created. In the sliced view, an arrow points to an exon that is present in all four models but is larger in the first one. Introns overlapping this exon in the other three models are larger.
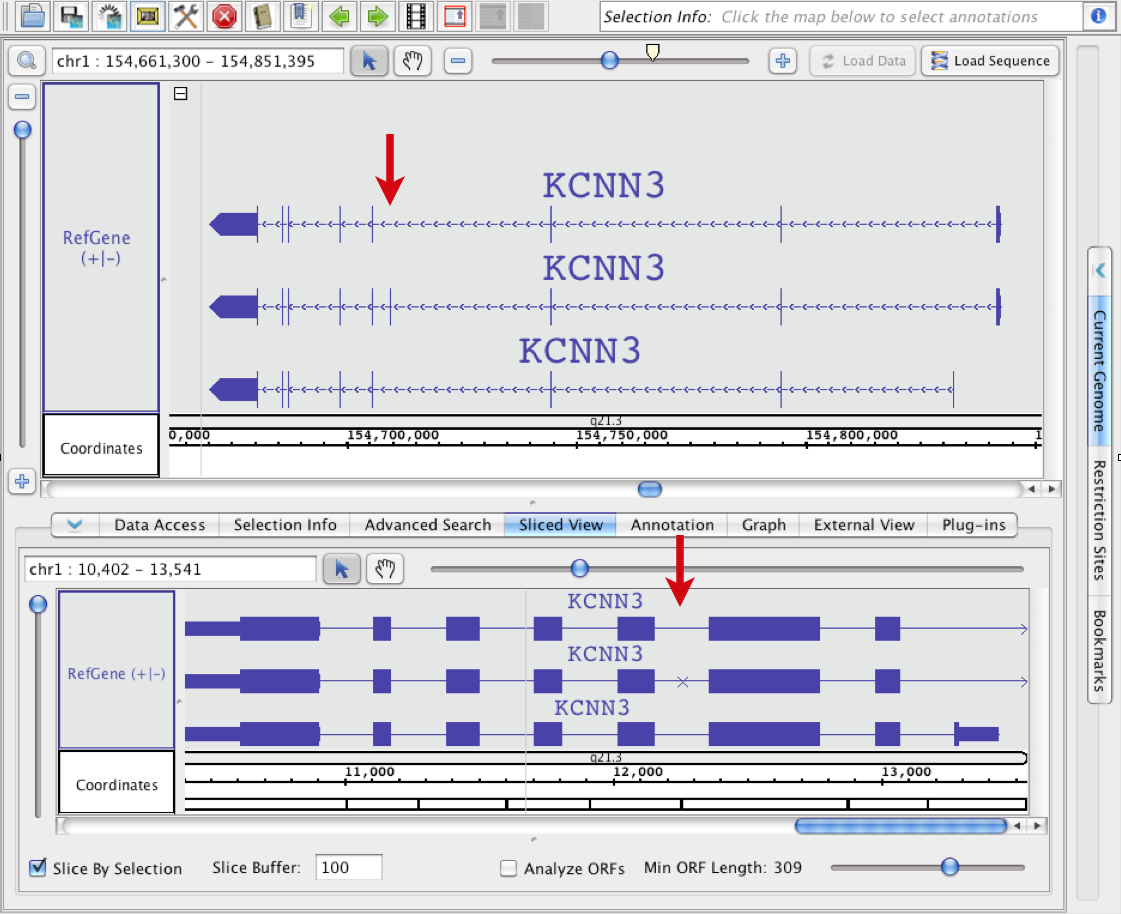
Deletion example
In this example, the bottom gene was selected in the main view . The other three transcripts each include one or more exons that were present in the top transcript. The locations of these "sliced-out: (deleted) exons relative to the other exons is indicated with X marks (red boxes). The exons that are 'shorter' than the matching exon in the selected track are drawn shorter (blue box).

...
when the sliced view was created. An arrow points to an exon in the main view that is present in the middle gene model but absent in the other two. Since the third model which doesn't include this exon was used to create the sliced view, the skipped exon is indicated using an X character in the Sliced View tab.
Showing ORFs and stop codons
The Sliced View panel can show open reading frames and stop codons.
To visualize open reading frames and stop codonescodons
- select Select an annotation in the Main View
- click Click the Sliced View tab
- check Check the Analyze ORFs checkbox
- use Use the Min ORF slider to adjust the mininum length of ORFs to show (in base pairs)
...
- )
...
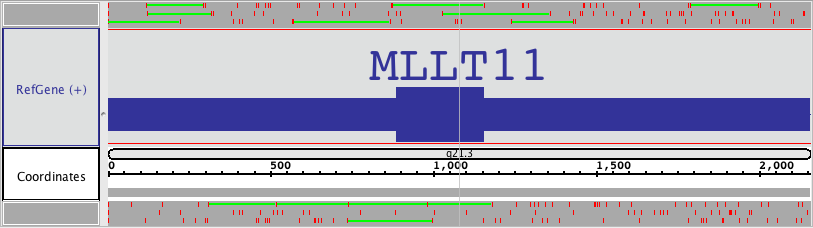
Three rows of ORFs will appear for + translations (blue box), and for each - translation (purple box)all six translation frames. Stop codons are shown as red hash marks, and the reading frames are marked marks. ORFs that are as long as or longer than the minimum ORF setting will be shown as green lines. The color of the stops, the ORFS and the background can be changed Stop codon and ORF colors can be set using Preferences > Other Options (see Other Options).
Sliced View ORF display.