Introduction
As you get to know IGB, you'll find it offers many features designed to enrich your genome browsing experience.
However, most of us want to 'jump right and make it work' and don't need to explore these many features right away.
Here we provide a brief Quick Start Guide to help you get started using IGB.
Bullet points link to pages that explain each topic.
Step 1: Choose your IGB
1. From the IGB homepage, go to Downloads or follow this link.
2. Click the IGB image to download and launch IGB. If your computer has enough memory, we recommend choosing the high memory (2 or 5 GB) option.
Step 2: Choose your species and genome version
IGB allows you to access species and genomes version in two ways. You can scroll through common model species from the main screen (red box); click the picture to be taken to the most recent genome version. You can also select the Species and the Genome Version from the options (blue box) to access the whole species list as well as access any publicly available genome version (including older ones). If your genome of interest is not listed, leave it set to 'Unknown Species' and 'Unknown genome.'
- See the list of supported species in IGB.
- For most common model species, IGB will automatically load the reference gene annotations. For instance, if you selected Homo sapiens from the picture link, IGB would load and display the refseq annotations for H. sapiens February 2009.
- If the annotations do not automatically load, you can select the annotations you are interested in from the Data Sources file tree. Open the server folders to find the data sets you would like to load (red box) and put a check mark in the box. IGB will create a place-holder track (orange box). Click either of the Load Data buttons (green arrows/boxes) to actually load the data into the view.
Step 3: Opening your own data files
For every file opened in IGB, a place holder track is created, to show you where your data will appear when visualized. The data set/file will also appear in the Data Management Table. NOTE: IGB does not immediately display the contents of your file; bioinformatics data files often contain enormous amounts of data, more than any program can display. For example, a single short reads alignments ("BAM") file may contain millions of read alignments. IGB generally sets files to Load Region in View, which allows you to select the size of the region that you are going to load.
- Details about loading data
- IGB supported file formats
- Details on adding servers
- Creating Quickload sites
Drag-and-drop your file into IGB
Select the file from a Web link or from your computer desktop, and just drag-and-drop the file into anywhere within the IGB window. You can also access files using File > If you are new to IGB, use this Quick Start Guide get started.
| Table of Contents |
|---|
Step 1: Get and start IGB
- Go to BioViz.org and click the Download button
- Select and download the installer for your platform
If you have trouble starting IGB, visit the help page on BioViz.org for assistance.
Step 2: Choose species and genome version
To choose a species and genome version
- Click a shortcut image (loads most recent genome)
or
- Choose Species and Genome Version using the Current Genome tab.
IGB start screen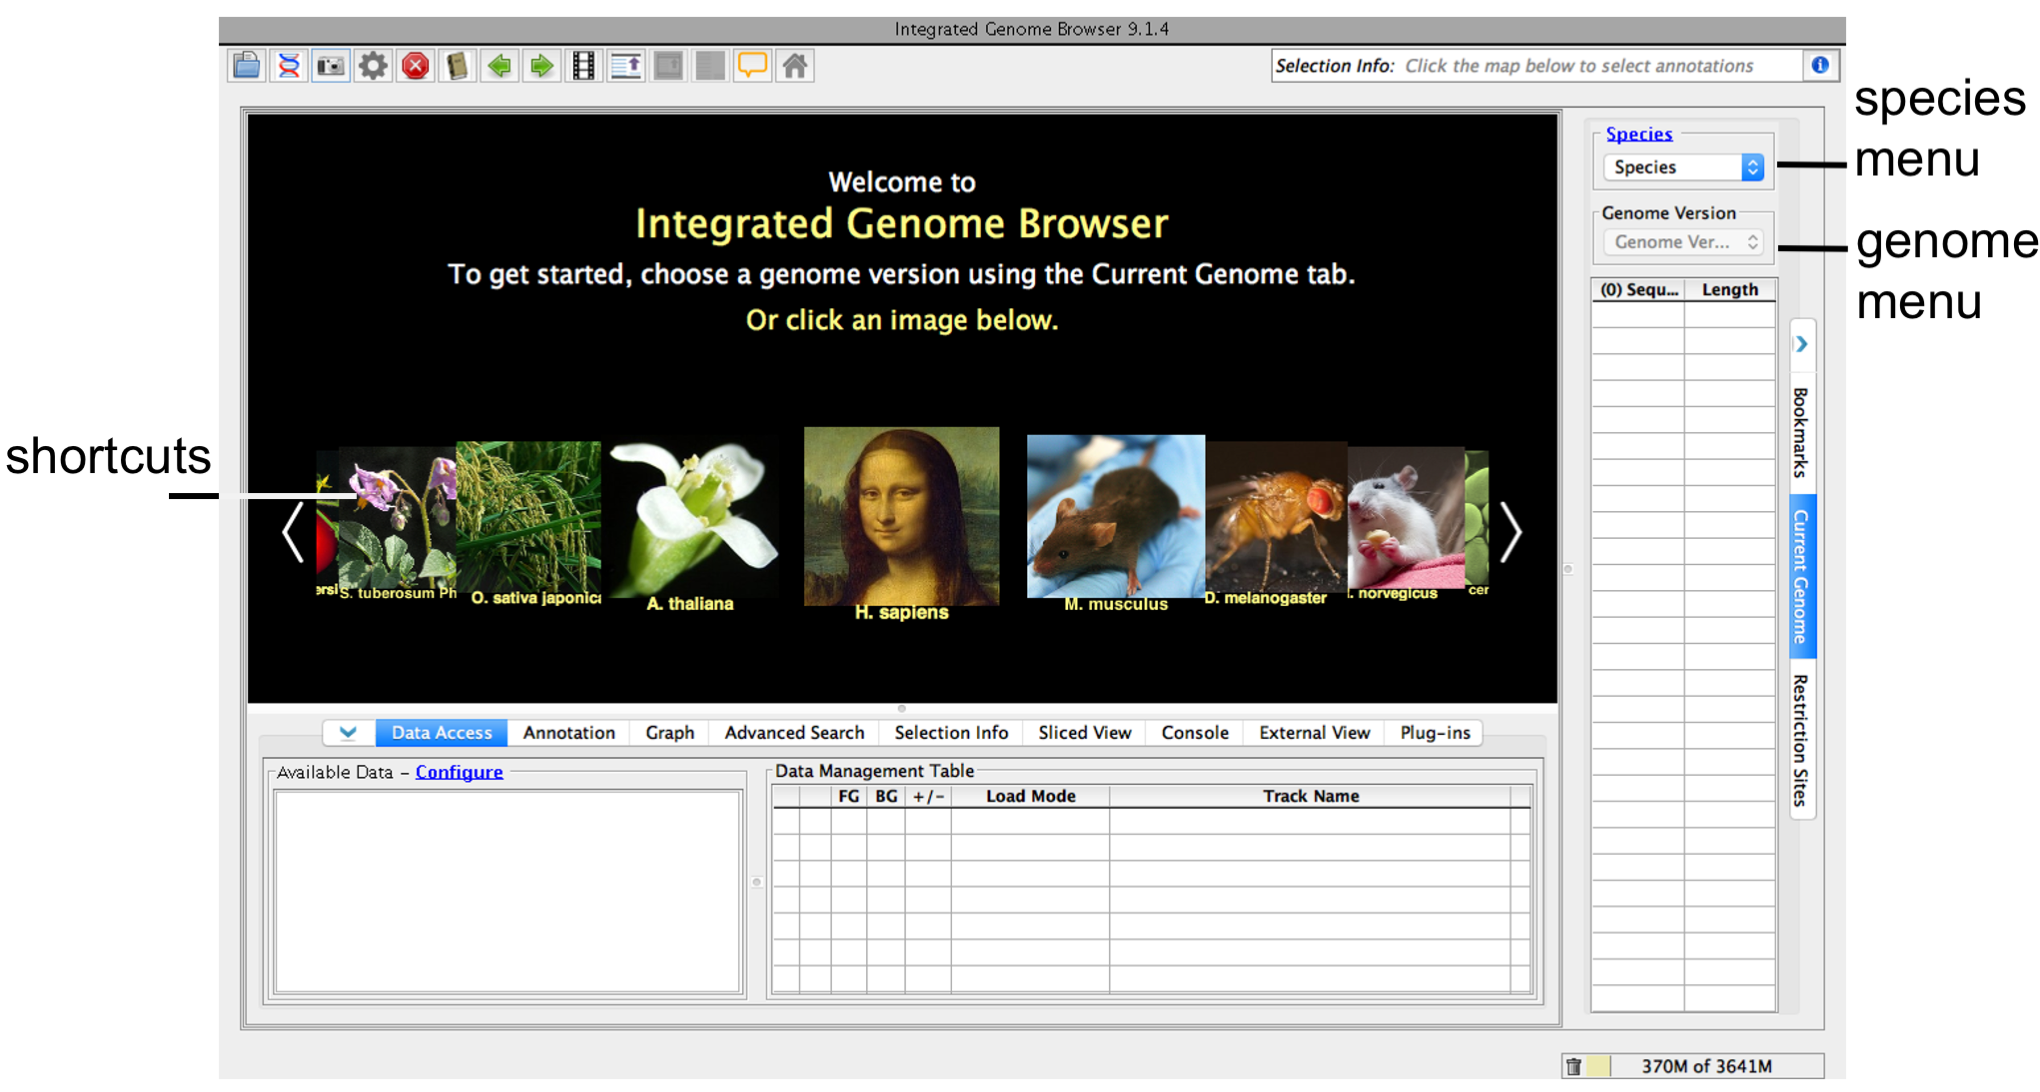
If your species or genome version is not listed, you can view it if you have a fasta or 2bit file with sequence data. See Custom Genomes
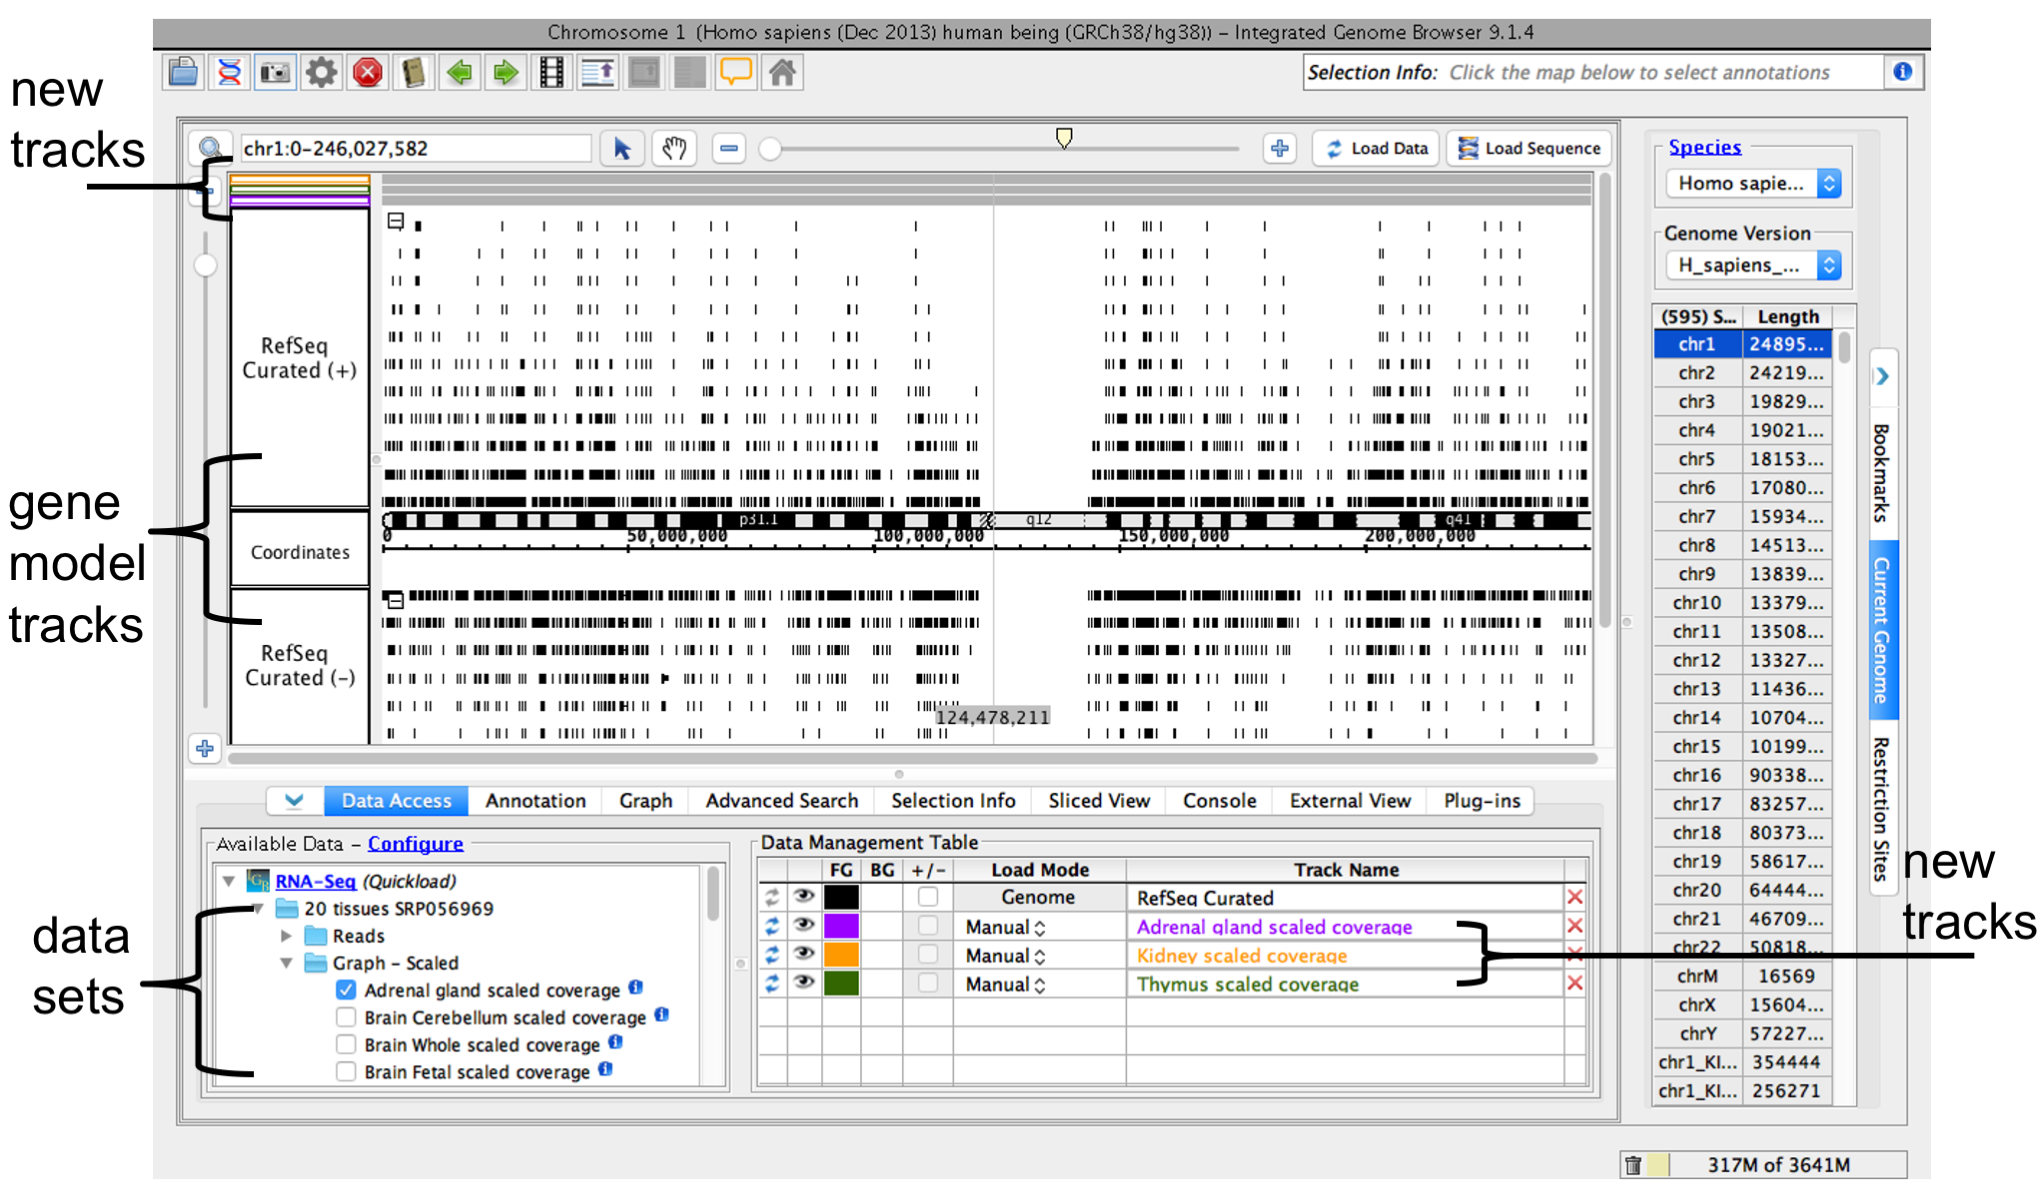
Step 3. Open data sets
Open data sets from remote data sources (Data Access tab) or by opening local files.
To open a data set from an IGB Quickload data source (see About IGB Quickload)
- Select Data Access
- Select data sets in the Available Data section
To open local files on your computer
- Select File > Open File... or File >
...
- Open URL...
...
Choose from Data Sources and Data Sets folders
As shown above, you can easily navigate through the folders in the Data Sources and Data Sets sub panel. Simply click the tracks you are interested in loading.
Step 4: Selecting a region of interest (Zooming in)
If you're working with large files such as .bam, .sam, .wig, .bedGraph, you should 'zoom in' to a smaller area before loading your data, ie select a smaller region of data to load. To zoom in on a region of interest, you can:
- Click the Search tab and enter the name of a gene. Click rows in the returned list to zoom to that feature (red box/arrow).
- Double click on a feature within the visual field to zoom to that feature (orange box/arrow).
- Enter a coordinate range in the coordinate box and hit enter to zoom to that location (green box/arrow)
- Click and drag within the coordinate axis to zoom to a region of interest (blue box/arrow).
- Use the zoom slider bar to zoom down to the gene model level (purple box/arrow).
- Use control+mouse wheel (Windows) or command+mouse wheel (Mac) to zoom in on the zoom stripe location (yellow box/arrow).
Step 5: Finish loading your data
Load the data for visualization from the Data Access tab either by using the Load Data button or the load icon for each individual track. Areas that are NOT loaded are grayed out (as you can see in the place holder tracks).
More about moving and zooming in IGB
1. Zooming. Use the sliders to zoom in or out on regions in IGB. To change the vertical zoom, use the vertical slider on to the left of data display window.
2. Pan left or right, up or down. Use the horizontal or vertical scrollbars to move left and right or up and down. Click-drag the arrow tool to pan left or right. Drag the hand (grab) tool left or right to adjust the display.
Note: At any time, you can hide or show the right, left or bottom trays, as well as increase the main viewing field. Adjust the size of the IGB window to get a layout you like.
Adjusting the Image and Other Aspects of IGB
...
- Enter file name or URL
When you select a data sets or a file, IGB adds a new empty track to the main view and lists it in the Data Management table. Empty regions in the new track that do not have data loaded are gray.
IGB window after opening human genome RNA-Seq coverage graphs from Adrenal Gland, Kidney, and Thymus data sets
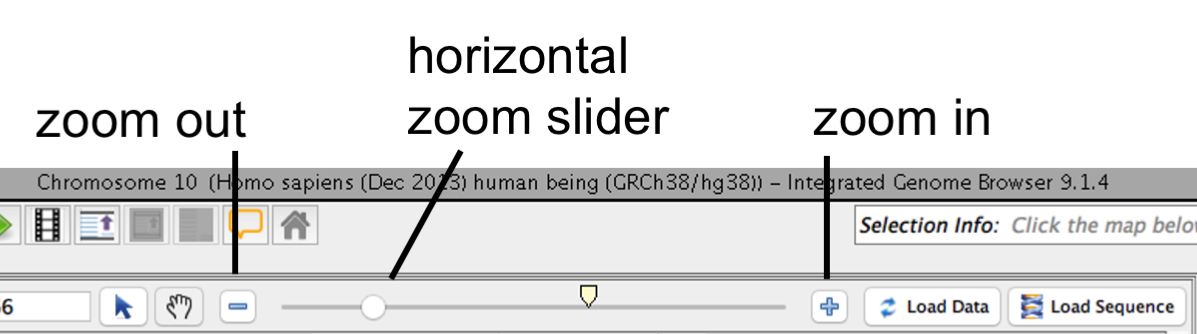
Step 4: Zoom in
Because many data files contain too much data to view all at once, IGB does not load data into the viewer until you click the Load Data button.
Before loading data, zoom in to a region.
- Click a location in the main view
- Drag the horizontal zoom slider or use plus and minus buttons
IGB horizontal zooming controls
Other ways to zoom
Other ways to zoom include
- Search for a gene by name or keyword (For example, TBATA or thymus)
- Double-click an exon or gene model to zoom in on it
- Click-drag the coordinate axis to zoom in on a region
See also:
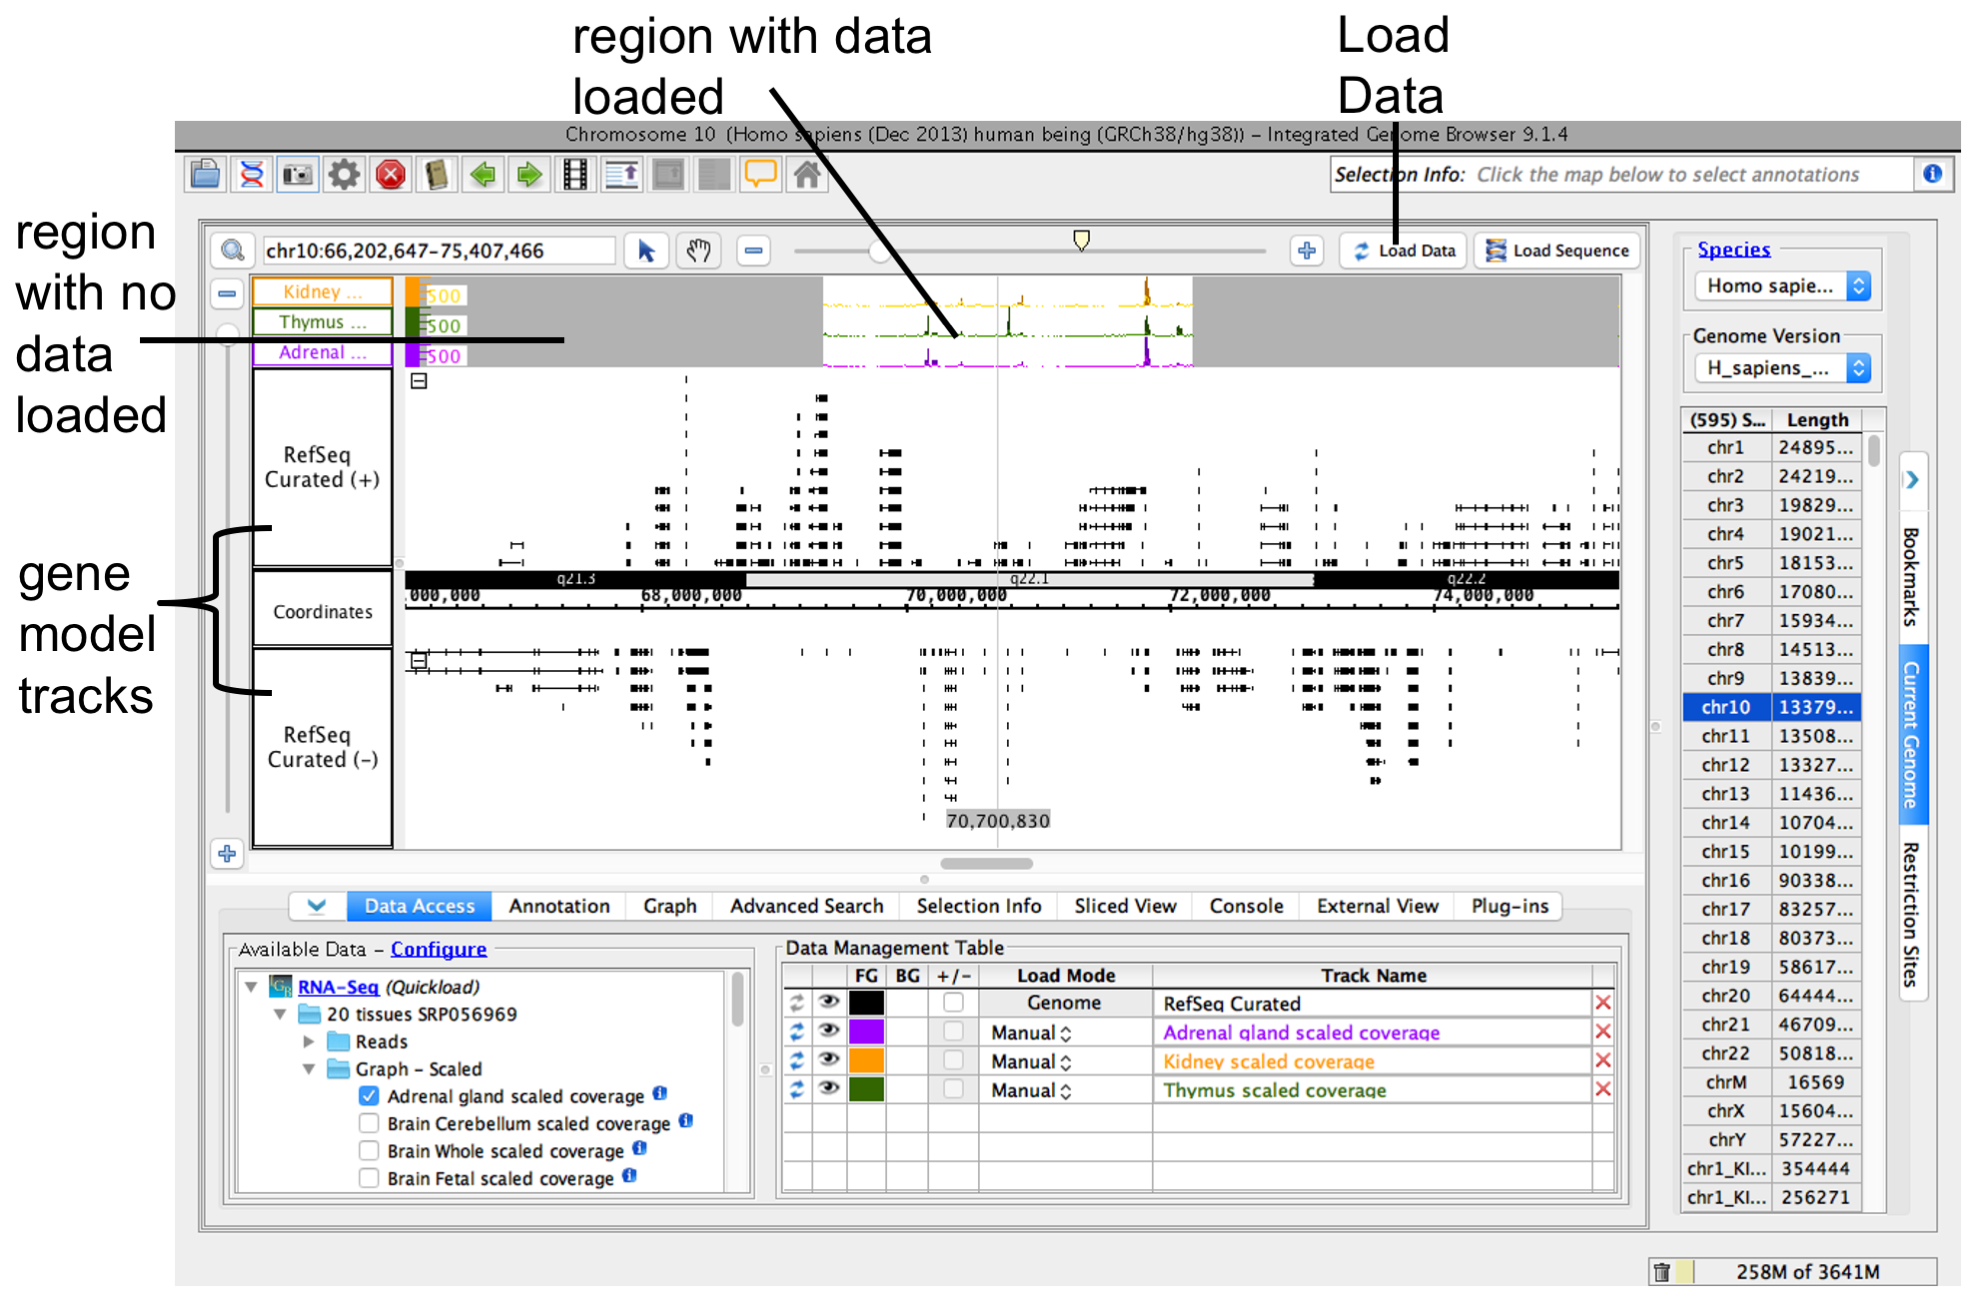
Step 5: Load data
To load data, click Load Data button. Regions with loaded data show the selected background color; areas without loaded data appear darker.
IGB after loading data
See also:
Step 6: Configure tracks
You can reorder the tracks by dragging the Track Label (the Data Management Table reflect changes).
To change style elements of a track, click the track label and use the Annotation or Graph tab to change to change color, track height, annotation label, amount of data shown (stack height), and other options.
See also: