This tab has been redesigned and expanded in IGB 6.6. This tab contains options addressing the color/appearance of non-track elements in the image, as well as some other miscellaneous options.

Coordinates
The options for changing axis appearance are here. You can change the foreground and background colors or customize the format used to present numbers. Changes to the colors take effect after closing the Preferences window.
You can alter how the numbers appear as follows.
...
| Table of Contents |
|---|
Introduction
Select File > Preferences > Other Options to configure the following:
- Coordinates track number format
- Sequence base colors
- ORF analyzer
- Edge matching
- Gene model translations
- Track resizing
- IGB exit and data set loading behaviors
Preferences Other options
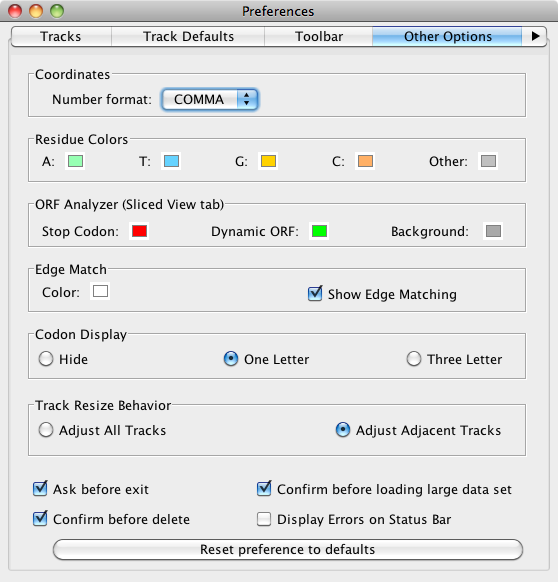
Coordinates
These are options for changing number appearance. FULL shows the number with no thousands separators and the unit 'kb'. COMMA shows the numbers with commas at every 10^3 (U.S. style) and with no unit designations. This is the default. ABBREV will show the numbers as abbreviated as is reasonable, with unit designations. For example, when zoomed out, numbers appear as 10M, 20M etc. Changes made here to Number Format take effect immediately.
Residue Colors
IGB highlights each residue in a different color displays letters representing DNA bases (residues) when zoomed-in. In this section, you can change color settings for residues. Residues are shown in alignment tracks, sequence tracks, and in underneath the coordinate axis.
By default, IGB uses cool colors for A and T residues and warmer colors for G and C residues. Other refers to residues that are either 'N', 'X' or '-' (missing) and can be set to a bright color if you are looking for deletions in short read sequences; otherwise you may wish to leave it as the neutral gray. Changes made in this section are immediately applied to the image.
Tip: If you do NOT wish for individual residues to be highlighted, set the colors to white or a light grey. Another great color scheme, if you are looking for CpG islands, is to set A and T to a neutral white or grey, make C a bright red and then G a moderate blue - this makes it easy for the eye to pick out the CG combination when skimming across genomic DNA.
Click a color swatch to change base colors.
ORF (Open Reading
...
Frame) Analyzer
These preferences affect colors used to indicate stop codons and , the ORFs shown in the Sliced View tab. After setting new color options, uncheck and recheck the Analyze ORFs option and the background of the ORF tracks that are shown in the Sliced View tab to show the new color scheme.
...
Edge Match
...
We have activated the ability to change the Edge Match color; this allows users who prefer a white background to make the Edge Match feature a different, visible color. The first image shows Edge Match in white (default) on the black background and the second shows the Edge Match in dark blue to distinguish it from the white background. The blue arrow in the images are the selected feature, and the red/ orange arrows point out the Edge Match highlights. 

Miscellaneous Options
IGB has included an option for the Prototype - View Mode, which will automatically change the default view to a depth graph view as you zoom out past a threshold. Details can be found Prototype - View Mode.
Edge matching highlights features that have identical boundaries. Edge matching becomes active when you click items in the display.
Click the swatch to change the edge match color. The selected color applies all annotation tracks.
| Tip |
|---|
Choose a color that has good contrast between foreground and background colors |
Codon Display
The Codon Display is activated when the sequence of a gene model is loaded and the user zooms in close enough to see the sequence. The codon translation appears within the gene model. User can set the amino acids to appear in one letter format (default), three letter format or be hidden. The colors is based on the chosen foreground color for the track.
| Info |
|---|
Codon display is active only for tracks loaded from 14-column BED detail files. |
Track Resize Behavior
Track Resize Behavior is how IGB adjusts other tracks when a specific track height is changed. Adjust All Tracks means that as a single track is increased in height, all other tracks are reduced by a commensurate amount. Adjust Adjacent Tracks (default) means that all added or subtracted height is removed/added to the bordering track, leaving the rest of the display unaffected.
Data loading and exit behaviors
Confirmations
IGB warns you when you are about to exit the program , and before you delete a file or files, and before you attempt to load alignments data (BAM files) for very large regions. Each of these warnings has the option to not be shown again. To turn off these warnings or reset your previous choice, check (or uncheck) Ask before exiting, Confirm before delete and/or Confirm before load.
Zoom Stripe Options
The Zoom Stripe is very useful for knowing your genomic location and for seeing the horizontal zoom focus. However, sometimes the Zoom Stripe label (genomic location) can impede your view of data. Unchecking Show Zoom Stripe label will hide this information. You can hide the zoom stripe entirely by unchecking Keep zoom stripe in view. This is useful sometimes when making images for publication or slides.
these options.
Reset all preferences to defaults
Click Reset all preferences to defaults to reset all the preferences to the IGB defaults. This is sometimes useful if you need to troubleshoot IGB.
| Warning |
|---|
Be careful, as this action will reset ALL preferences and will also cause IGB to forget the location you were last viewing. |
...