...
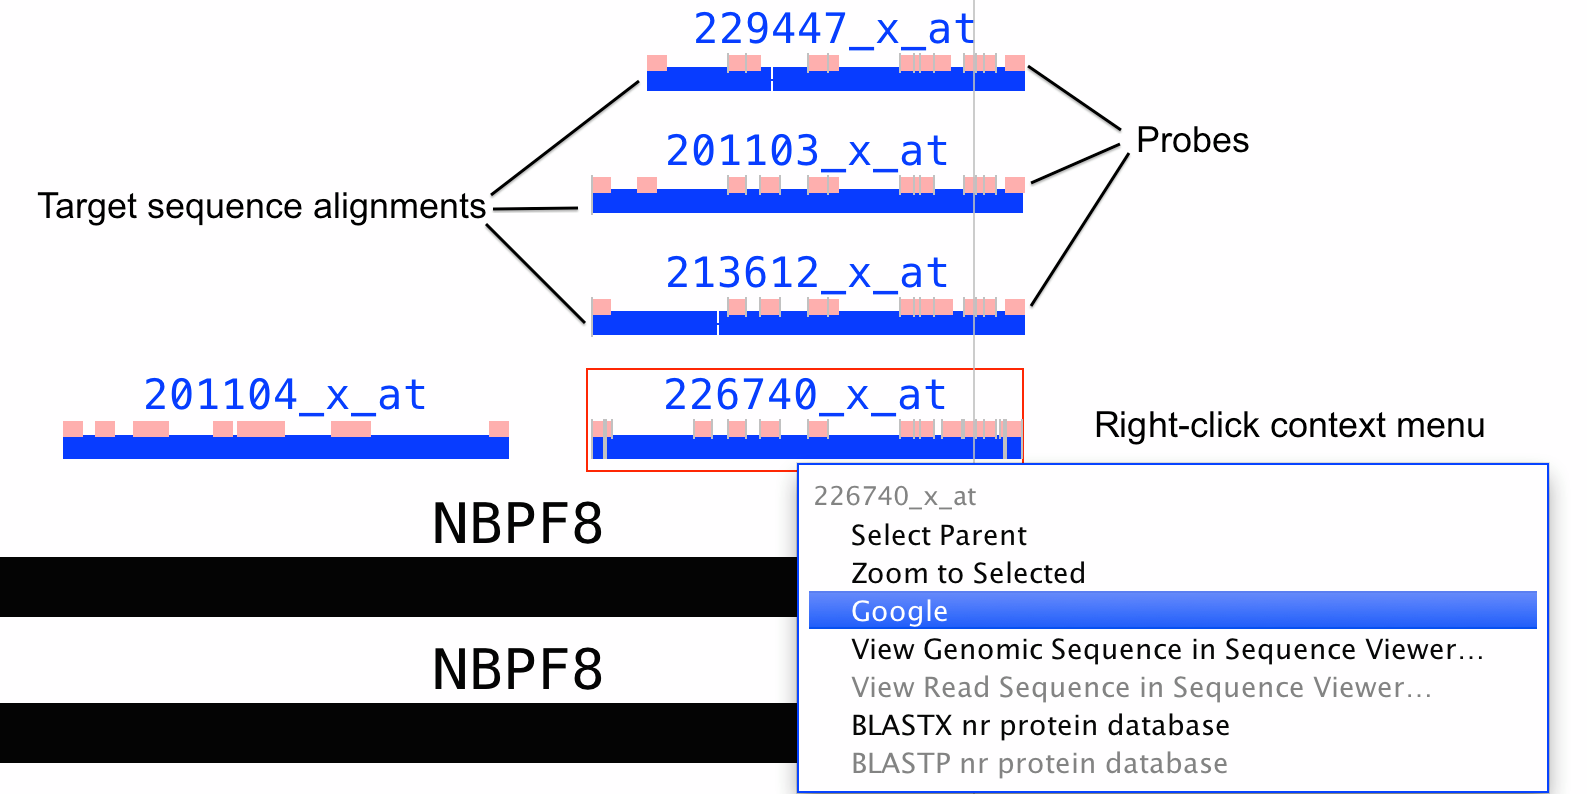
IGB can display Affymetrix probe sets aligned onto a reference genome - it can show probe set design sequences aligned onto a genome with the locations of the probes indicated as blocks.
When IGB was first developed , Affymetrix made at Affymetrix, the company distributed probe set alignment files available for all its catalog 3' IVT arrays. In recent years, however, they've stopped make updating these data availablefiles. For So for some genomes, the alignment files you can find on the IGB team has made probe set alignments data available through our Affymetrix Web site reference obsolete reference genomes. If you need to work with more up-to-date genomes, we recommend you create your own alignment files or request them from the IGB team. For some genomes, we've added probe set alignments to the main IGBQuickLoad.org site. Mainly we've done this at the request of individual researchers; , and so if you would like us to add the probe sets for a particular to request an array, let us know. Note that if If probe set alignments are available from our site, you'll typically find them in a folder named Affymetrix under the Data Sources section of the Data Access panel.
If you would like to create You can also make your own probe set alignment files for visualization in IGB, please see this Bitbucket repository, which contains a python script and instructions for making probe set alignment (link.psl) files that IGB can open and displayusing blat, tabix, and a python script we wrote. For more information, this Bitbucket repository.
Probe set target sequence
The alignment between the probe set target sequence and the genome is represented at the top of the figure as a series of blocks. Each block represents a block of alignment in which each base in the genome matches a corresponding base in the target sequence. Gaps between the blocks typically represent areas where the genomic sequence contains inserts relative to the aligned target sequence. Usually, these gaps are due to introns.
There are some exceptions to this, however. For example, the sixth and seventh blocks in the figure above are so close together that they almost appear as a single block at this level of zoom.
Zooming in for a closer view reveals that these two alignment blocks are immediately adjacent to each other. This indicates that these two blocks of alignment were separated by an insert in the target sequence relative to the genomic sequence. That is, the target sequence contained some bases that were not present in the genomic sequence. This may present a problem if this missing region (in the genome, that is) contains some probe sequences. In this particular case, however, the alignment irregularity occurs in a 5' region, outside the area covered by the probes. (See the discussion below.)
How can this happen? There are a number of reasons, but discrepencies between the genomic and target sequences are usually responsible.
Probes and probe sets.
Each target sequence is shown with its corresponding probe set. Each probe set consists of a group of probes, which are shown superimposed on the alignment blocks of the target sequence.
The figure below shows a close-up view near the 3' end of the target sequence. The 3' end of the target sequence is annotated with blocks which represent individual probes.
Two things are important to notice about this image. First, sometimes individual probes are split across gaps in the alignment, which typically correspond to introns. When this occurs, the two halves of the probe are connected by a line.
...
About probe set alignment visualizations
Depending on when the arrays were designed, Affymetrix typically used expressed sequences from GenBank to select probes for probe sets. They then selected a region near the 3' end of each and then selected individual probes from that region. They distribute the sequences of probes in a probe set on their Web site, along with files labeled "target sequences" that contain the region from which the probes were selected. They also distribute what they call "exemplar" and "consensus" sequences taht contain the smaller target region from which the probes were selected.
Probe set visualization in IGB show the alignments of target, exemplar, or consensus sequences onto the genome. They also show the locations of probes that were selected from the design sequence. See the preceding figure for an example.
Because probes were selected from the expressed sequences, sometimes a probe will be shown as split across an intron. Also, sometimes probes overlap. And sometimes probes may be missing. If the target sequence contains a region that can't align onto the reference, and if this unaligned sequence contains a probe, then that probe will not be shown.
If you have questions about what you see in a probe set alignment, let us know.

