...
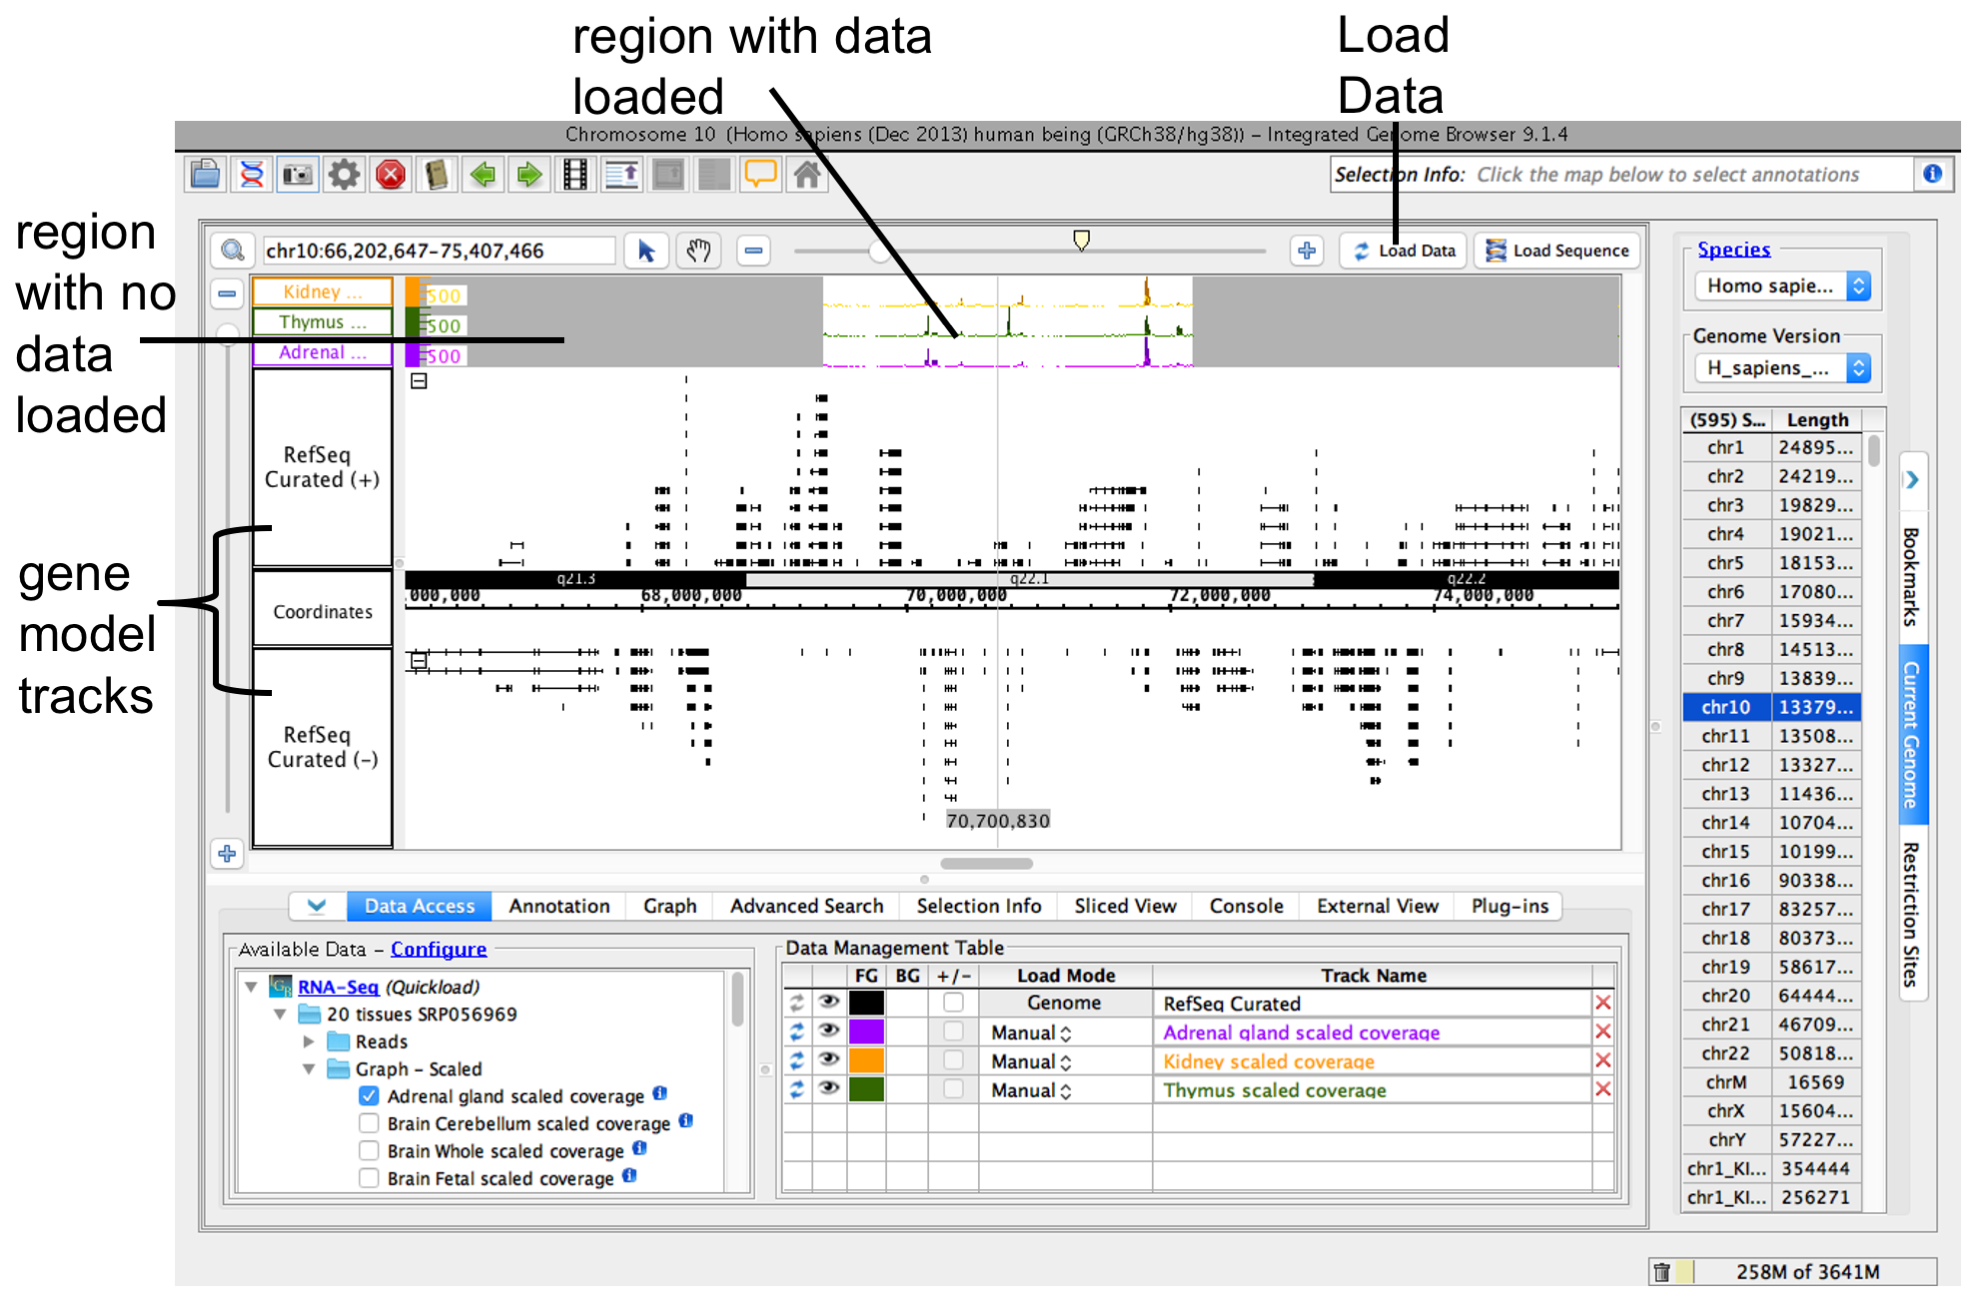
When you select a data sets or a file, IGB will add a new empty track to the main view and list it in the Data Management table. Regions that do not have data loaded have a darker background color.
...
- Select File > Open Reference Sequence...
- Choose the file you want to open
Step 4: Zoom in
Because many data files contain too much data to view all at once, IGB does not start loading load data into the viewer until you click the Load Data button.
Before loading data, first zoom in to a region you want to view.
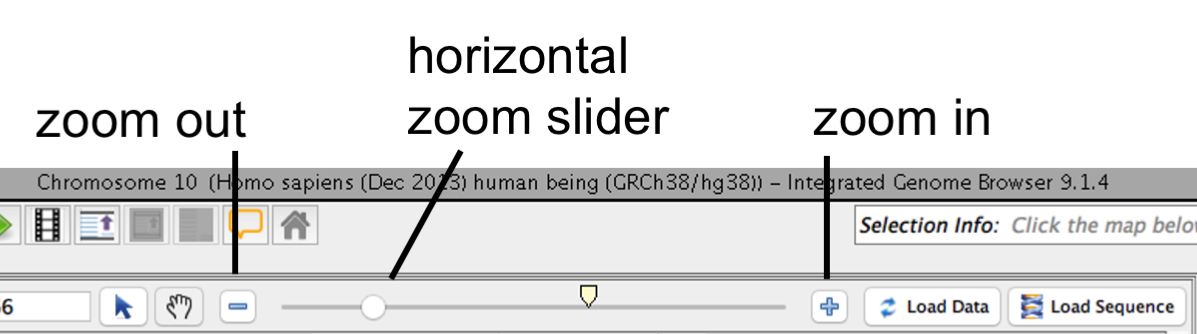
To zoom in on a region
- Focus zooming by clicking Click a location in the main view
- Drag the horizontal zoom slider to the rightor use plus and minus buttons
IGB horizontal zooming controls
...
Other ways to zoom include
- Search for a gene using the search boxby name
- Double-click a feature to zoom in on it
- Click-drag over within the axis to zoom in on a regionClick the plus and minus buttons next to zoom sliderscoordinate axis
See also:
Step 5: Load data
To load data for the currently visible region, click Load Data button. Regions with loaded data have a lighter background color matching the background color setting for the trackshow the selected background color; areas without loaded data appear darker.
IGB after loading data
See also:
...
You can reorder the tracks by dragging the Track Label into the position you want (the Data Management Table reflect changes).
Select To change style elements of a track by clicking its , click the track label and click use the Annotation or Graph track tab to change to change color, track height, annotation label, amount of data shown (stack height), and other options.
...