...
The Sliced View tab displays an alternative "sliced" view of items selected in the Main View. It displays the same data as in the Main View but deletes some of the intronic "space" within gene models.
It is mainly useful in depicting mammalian genes which often span many kilobases and mostly consist of intronic sequence.
The following image shows how this works. The top panel of the IGB Main View window shows the normal, non-spliced view of a region containing overlapping genes from a human, AGBL4 which contains several very large introns, one of which completely encompasses another gene, BEND5. The Sliced View panel on the bottom shows AGBL4, and then BEND5, but with the gaps between exons reduced to 100bp.
Black hash marks in the Sliced View coordinate axis indicate points where sequence was deleted from between the exons. Note how the Sliced View makes understanding and visualizing the exons easier than in the Main View, where exons are dwarfed by the much larger intronic regions.
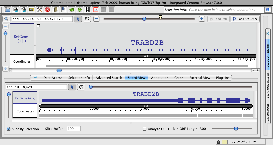
Sliced view example (click to enlarge)

Sliced view example (click to enlarge)

The Sliced View Panel
The Sliced View panel provides you with the opportunity to concentrate on specific elements of gene models. Slicing redraws long and variable length introns into consistent, defined (and short) lengths, allowing you to focus on the exons of a selected annotation or set of annotations. By showing the exons relative to each other without intronic variability, you can find pattern irregularities, exonic discrepencies and possible alternate splicing more obvious.
Open the Sliced View panel, and be sure that the Slice Buffer is set to a number you like. The Slice Buffer is the size that IGB will use to draw in the introns. The default is 100bp, which is typically a very good size for most genes (see red box in image below); you may also set the slice buffer to 0 to completely eliminate the introns. In the main view, select one or all annotations to include in the slice by clicking or outlining with the Select tool (Selecting Items). In the following example we have selected all 4 gene models for human gene PDE4B.
 compresses genes models by trimming introns.
Sliced view example (click to enlarge)
Using Sliced View
- Click the Slicked View tab to make it the active bottom tab
- For maximum usefulness, open the Sliced View tab in a separate window (Tabs > Open Current Bottom Tab in New Window)
- Click a gene model in the Main View
- Observe the same gene model shown in the Sliced View but with compressed intronic regions
- Note that the Coordinates track in the Sliced view are relative to the start of the Sliced View region; they don't indicate absolute genomic coordinates.
Sliced View options
Slice by Selection
Slice Buffer
The Slice Buffer setting controls the size of introns drawn in the Sliced View display.
Analyze ORFs
Check this option to activate display of ORFs (open reading frames) underneath the Sliced View coordinate axis* track.
Min ORF Length
IGB may take a few moments to display the sliced region. For easy comparison, the sliced view displays sliced versions of all annotation tracks and graphs in the region being viewed. Use the zoom and scroll bars to navigate in the sliced view panel. Note that the numbers in the Coordinates track in the sliced view panel indicate scale; they don't correspond to genomic coordinates. Endpoint matching in the upper and lower windows are independent of each other.
...